Amygdala-hippocampal involvement in human aversive trace conditioning revealed through event-related functional magnetic resonance imaging - PubMed (original) (raw)
Clinical Trial
Amygdala-hippocampal involvement in human aversive trace conditioning revealed through event-related functional magnetic resonance imaging
C Büchel et al. J Neurosci. 1999.
Abstract
Previous functional neuroimaging studies have characterized brain systems mediating associative learning using classical delay conditioning paradigms. In the present study, we used event-related functional magnetic resonance imaging to characterize neuronal responses mediating aversive trace conditioning. During conditioning, neutral auditory tones were paired with an aversive sound [unconditioned stimulus (US)]. We compared neuronal responses evoked by conditioned (CS+) and nonconditioned (CS-) stimuli in which a 50% pairing of CS+ and the US enabled us to limit our analysis to responses evoked by the CS+ alone. Differential responses (CS+ vs CS-), related to conditioning, were observed in anterior cingulate and anterior insula, regions previously implicated in delay fear conditioning. Differential responses were also observed in the amygdala and hippocampus that were best characterized with a time x stimulus interaction, indicating rapid adaptation of CS+-specific responses in medial temporal lobe. These results are strikingly similar to those obtained with a previous delay conditioning experiment and are in accord with a preferential role for medial temporal lobe structures during the early phase of conditioning. However, an additional activation of anterior hippocampus in the present experiment supports a view that its role in trace conditioning is to maintain a memory trace between the offset of the CS+ and the delayed onset of the US to enable associative learning in trace conditioning.
Figures
Fig. 1.
Illustration of the experimental design.A, According to a 50% partial reinforcement, only one-half of the presentations were followed by the US (i.e., CS+paired). Dotted and_dash-dotted vertical lines_ indicate the onset of the CS and US, respectively. The three plots show the modeled hemodynamic responses. Temporal and dispersion derivatives are omitted for clarity. Responses are time-locked to the offset of the CS (CS−, CS+unpaired, and CS+paired). The_dashed line_ in the last row is an example for a hypothetical response evoked by the US. Note the overlap in time of hemodynamic responses for the paired CS+ and the US. The time scale indicates that the ITI was randomized to introduce a phase shift between sampling and stimulus onset (see Materials and Methods for details). Thin vertical lines in the second row demonstrate the relationship between the acquisition of fMRI volumes and the presentation of stimuli. B, Details of the temporal relationship between CS+ and US. Note that, because of the partial reinforcement scheme, only 50% of the CS+ were actually followed by a US.
Fig. 2.
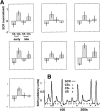
A, Average SCRs for all seven subjects that showed conditioned responses during the experiment. Each graph represents the SCR data from an individual subject. The_first two bars_ represent the mean SCR responses during the first half of the experiment for CS− and CS+unpairedtrials, respectively. The third and fourth bars show the SCR data for CS− and CS+unpaired for the second half of the experiment. For all but subject 6, it is obvious that the significant difference between CS− and CS+ SCRs decreased during the second half of the experiment. B, Recorded SCR data for subject 6. + indicates the onset of a CS+ stimulus. ○ indicates the onset of a CS− stimulus. x indicates the onset of the aversive tone (US) after 50% of CS+ (○). Stronger SCR responses are evoked by CS+ trials (+), even in the absence of the US (x).
Fig. 3.
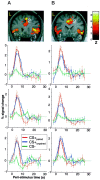
Significant differential visual evoked responses for CS+ versus CS− tones in the anterior cingulate cortex and the right and left insulae for two individual subjects (subject 5 in_A_ and subject 6 in B). The coronal slice of the subject's individual T1-weighted MRI shows the location of differential responses. Images are thresholded at p< 0.001 uncorrected for visualization. The significance for individual activations are given in Table 1. The peristimulus time plots are shown for all three regions. The fitted response and the adjusted data (±SEM) are plotted for 2 sec time bins. Although responses are shown for CS+paired, CS+unpaired, and CS−, the statistical inference is based on the difference between CS+unpaired and CS−.
Fig. 4.
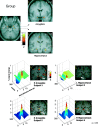
Medial temporal lobe activations revealed by the group analysis. Medial temporal lobe activation comprised an anterior activation in the amygdala and a posterior activation in the anterior hippocampus. As can be seen on the transverse section, the activation of the hippocampus cannot be explained by the spatial smoothing of 6 mm (full-width at half maximum).
Similar articles
- Brain systems mediating aversive conditioning: an event-related fMRI study.
Büchel C, Morris J, Dolan RJ, Friston KJ. Büchel C, et al. Neuron. 1998 May;20(5):947-57. doi: 10.1016/s0896-6273(00)80476-6. Neuron. 1998. PMID: 9620699 - Amygdala Adaptation and Temporal Dynamics of the Salience Network in Conditioned Fear: A Single-Trial fMRI Study.
Yin S, Liu Y, Petro NM, Keil A, Ding M. Yin S, et al. eNeuro. 2018 Feb 28;5(1):ENEURO.0445-17.2018. doi: 10.1523/ENEURO.0445-17.2018. eCollection 2018 Jan-Feb. eNeuro. 2018. PMID: 29497705 Free PMC article. - Activation of the ventral striatum during aversive contextual conditioning in humans.
Pohlack ST, Nees F, Ruttorf M, Schad LR, Flor H. Pohlack ST, et al. Biol Psychol. 2012 Sep;91(1):74-80. doi: 10.1016/j.biopsycho.2012.04.004. Epub 2012 Apr 26. Biol Psychol. 2012. PMID: 22560888 - Synaptic plasticity in the lateral amygdala: a cellular hypothesis of fear conditioning.
Blair HT, Schafe GE, Bauer EP, Rodrigues SM, LeDoux JE. Blair HT, et al. Learn Mem. 2001 Sep-Oct;8(5):229-42. doi: 10.1101/lm.30901. Learn Mem. 2001. PMID: 11584069 Review. - Human fear conditioning and extinction in neuroimaging: a systematic review.
Sehlmeyer C, Schöning S, Zwitserlood P, Pfleiderer B, Kircher T, Arolt V, Konrad C. Sehlmeyer C, et al. PLoS One. 2009 Jun 10;4(6):e5865. doi: 10.1371/journal.pone.0005865. PLoS One. 2009. PMID: 19517024 Free PMC article. Review.
Cited by
- The brain basis of emotion: a meta-analytic review.
Lindquist KA, Wager TD, Kober H, Bliss-Moreau E, Barrett LF. Lindquist KA, et al. Behav Brain Sci. 2012 Jun;35(3):121-43. doi: 10.1017/S0140525X11000446. Behav Brain Sci. 2012. PMID: 22617651 Free PMC article. Review. - Neural correlates of sensory preconditioning: a preliminary fMRI investigation.
Yu T, Lang S, Birbaumer N, Kotchoubey B. Yu T, et al. Hum Brain Mapp. 2014 Apr;35(4):1297-304. doi: 10.1002/hbm.22253. Epub 2013 Mar 1. Hum Brain Mapp. 2014. PMID: 23450811 Free PMC article. - Human trace fear conditioning: right-lateralized cortical activity supports trace-interval processes.
Haritha AT, Wood KH, Ver Hoef LW, Knight DC. Haritha AT, et al. Cogn Affect Behav Neurosci. 2013 Jun;13(2):225-37. doi: 10.3758/s13415-012-0142-6. Cogn Affect Behav Neurosci. 2013. PMID: 23263840 - Basal forebrain cholinergic systems as circuits through which traumatic stress disrupts emotional memory regulation.
Knox D, Parikh V. Knox D, et al. Neurosci Biobehav Rev. 2024 Apr;159:105569. doi: 10.1016/j.neubiorev.2024.105569. Epub 2024 Feb 1. Neurosci Biobehav Rev. 2024. PMID: 38309497 Review. - Subunit composition of strychnine-sensitive glycine receptors expressed by adult rat basolateral amygdala neurons.
McCool BA, Farroni JS. McCool BA, et al. Eur J Neurosci. 2001 Oct;14(7):1082-90. doi: 10.1046/j.0953-816x.2001.01730.x. Eur J Neurosci. 2001. PMID: 11683900 Free PMC article.
References
- Bechara A, Tranel D, Damasio H, Adolphs R, Rockland C, Damasio AR. Double dissociation of conditioning and declarative knowledge relative to the amygdala and hippocampus in humans. Science. 1995;269:1115–1118. - PubMed
- Breiter HC, Etcoff NL, Whalen PJ, Kennedy WA, Rauch SL, Buckner RL, Strauss MM, Hyman SE, Rosen BR. Response and habituation of the human amygdala during visual processing of facial expression. Neuron. 1996;17:875–887. - PubMed
Publication types
MeSH terms
LinkOut - more resources
Full Text Sources
Medical


