Genes expressed in Pinus radiata male cones include homologs to anther-specific and pathogenesis response genes - PubMed (original) (raw)
Comparative Study
Genes expressed in Pinus radiata male cones include homologs to anther-specific and pathogenesis response genes
A R Walden et al. Plant Physiol. 1999 Dec.
Abstract
We describe the isolation and characterization of 13 cDNA clones that are differentially expressed in male cones of Pinus radiata (D. Don). The transcripts of the 13 genes are expressed at different times between meiosis and microspore mitosis, timing that corresponds to a burst in tapetal activity in the developing anthers. In situ hybridization showed that four of the genes are expressed in the tapetum, while a fifth is expressed in tetrads during a brief developmental window. Six of the seven cDNAs identified in database searches have striking similarity to genes expressed in angiosperm anthers. Seven cDNAs are homologs of defense and pathogen response genes. The cDNAs identified are predicted to encode a chalcone-synthase-like protein, a thaumatin-like protein, a serine hydrolase thought to be a putative regulator of programmed cell death, two lipid-transfer proteins, and two homologs of the anther-specific A9 genes from Brassica napus and Arabidopsis. Overall, our results support the hypothesis that many of the reproductive processes in the angiosperms and gymnosperms were inherited from a common ancestor.
Figures
Figure 1
P. radiata male (left) and female (right) cones photographed during male cone dehiscence.
Figure 2
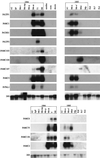
Temporal expression analysis. Northern blots of total RNA extracted from male cones during two flowering seasons. Abbreviations for male cones are given in Table I. Needle, root, and shoot data (where presented) are as indicated, and the abbreviations for female cones are as follows: Fc8, female cones 8 months before meiosis; Fc7, female cones 7 months before meiosis; Fc4, female cones 4 months before meiosis. Expression data and transcript size are summarized in Figure 3 and Table II. Loading differences were assessed by probing blots with a 26S rRNA probe as indicated. Note that there is wide variation in the loading of samples between lanes, with some samples underloaded (e.g. T1, Misi); this is the likely cause of the apparent transient down-regulation of genes such as PrLTP1 in T1-stage cones. Faint smears immediately adjacent to lanes containing strongly hybridizing bands (e.g. PrMC104, T1 sample) have been interpreted as noise in the summary in Figure 3.
Figure 3
Most cDNAs are expressed from before to just after meiosis. This figure illustrates the expression of the 13 cDNAs at different stages of pollen development (top). Development progresses from left to right. The cDNAs are labeled on the left side of the figure. An oval spot represents expression. Abbreviations for male cones are given in Table I. Bars indicating the size of developing pollen are 9 μm. Me-iep- to Me-at-stage meiocytes are enlarged by a factor of two.
Figure 4
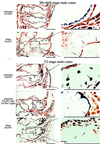
Spatial expression of five genes in P. radiata male cones. Me-tIpII-stage- and T2-stage male cones (top and bottom, respectively) were sectioned and probed with sense (control) and antisense transcripts of five cDNAs. The results for PrChS1, PrLTP1, PrMC1, and PrMC2 were similar and are represented above by the results of PrChS1 and PrLTP1. The result for PrLTP2 is illustrated separately above. The bar beneath each image represents 250 μm; rectangles indicate the origin of the enlarged images. Detection of transcript is indicated by the blue/black tetrazolium blue signal (arrow) and in the control sections arrows indicate corresponding tissue.
Figure 5
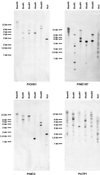
Southern-blot analysis. Blots of genomic DNA (10 μg per lane, digested as indicated) were probed with the cDNA clones indicated. Clones with an average of less than three signals per digest were scored as low (e.g. PrChS1 and PrMC3), three to seven bands were scored as intermediate (e.g. PrMC187), and eight or more bands were scored as high copy (e.g. PrLTP1, data summarized Table II).
Figure 6
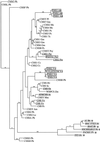
Phylogenetic analysis of ChS and StS-like sequences. The figure illustrates the tree generated when ChS and StS amino acid sequences corresponding to bases 8 to 386 of PrChS1 were aligned and subjected to a phylogenetic analysis. Five of the six sequences (indicated by asterisks) in the PrChS1 clade are specific to male reproductive tissues. ChS sequences from plant species corresponding to those represented in the PrChS1 clade are shaded gray. The distribution of StS sequences (boxed) throughout the phylogram suggests that StS evolved from ChS several times independently during evolution (also see Tropf et al., 1994). ChS sequences from plant species corresponding to the StS sequences are underlined. Abbreviations are as follows: Ph, Petunia hybrida; Ah,Arachis hypogaea; Pl, _Pueraria lobata;_Gm, Glycine max; Ms, Medicago sativa; Ps,Pisum sativum; Ts, Trifolium subterraneum; Psy, Pinus sylvestris; Pst,Pinus strobus; Cs, Camellia sinensis; Vv,Vitis vinifera; Bn, Brassica napus; At, Arabidopsis; Br, Brassica rapa; Ns, Nicotiana sylvestris; Os, Oryza sativa; Pr, P. radiata; Hv, Hordum vulgare; Sc, S. cereale; Zm, Z. mays; Mm, Matthiola incana; Pc, Petroselinum crispum; Am,Antirrhinum majus; Le, Lycopersicon esculentum.
Figure 7
Comparison of deduced LTP and A9 anther-expressed proteins. Deduced sequences of nsLTPs (PrLTP1, PrLTP2, E2, OsLTP, and bLTP) and A9 homologs (PrMC1, PrMC2, Men-8, Lhm7, and A9) were aligned using the GCG program PileUp. The eight conserved Cys residues are shown beneath the alignment. The four helical domains of the barley LTP are labeled A, B, C, and D as indicated. The cleavage site for removal of the secretory sequence predicted by the GCG program SPSCAN is indicated by asterisk. The eight conserved Cys residues are shaded. Accession numbers are Men-8, y08780; LHm7, x80719; A9, q05772; barley LTP, p07597; OsLTP, u29176; and E2, x60318.
Figure 8
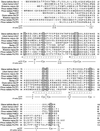
Alignment of PrMC3 with four homologs. The figure shows an alignment of deduced amino acid sequences for four homologs of PrMC3. The Ser hydrolase GXSXG motif is enclosed in a box, and bases identical in three or more sequences are shaded. Accession numbers for the sequences are as follows: Medicago expressed sequence tag, aa660803; tobacco hsr203J, s42807; tulip_arylacylamidase_, e03271; and_Mycobacterium_ seq., z80108.
Similar articles
- Brassica anther-specific genes: characterization and in situ localization of expression.
Shen JB, Hsu FC. Shen JB, et al. Mol Gen Genet. 1992 Sep;234(3):379-89. doi: 10.1007/BF00538697. Mol Gen Genet. 1992. PMID: 1406584 - Expression of an anther-specific chalcone synthase-like gene is correlated with uninucleate microspore development in Nicotiana sylvestris.
Atanassov I, Russinova E, Antonov L, Atanassov A. Atanassov I, et al. Plant Mol Biol. 1998 Dec;38(6):1169-78. doi: 10.1023/a:1006074508779. Plant Mol Biol. 1998. PMID: 9869422 - PRFLL--a Pinus radiata homologue of FLORICAULA and LEAFY is expressed in buds containing vegetative shoot and undifferentiated male cone primordia.
Mellerowicz EJ, Horgan K, Walden A, Coker A, Walter C. Mellerowicz EJ, et al. Planta. 1998 Nov;206(4):619-29. doi: 10.1007/s004250050440. Planta. 1998. PMID: 9821691 - Isolation of rapeseed genes expressed early and specifically during development of the male gametophyte.
Fourgoux-Nicol A, Drouaud J, Haouazine N, Pelletier G, Guerche P. Fourgoux-Nicol A, et al. Plant Mol Biol. 1999 Jul;40(5):857-72. doi: 10.1023/a:1006282507095. Plant Mol Biol. 1999. PMID: 10487220
Cited by
- Genome-wide identification of rice CXE gene family and mining of alleles for potential application in rice improvement.
Zhang J, Wang X, Dou G, Meng D, Tang C, Lv J, Wang N, Wang X, Li J, Bao Y, Zhang G, Huang T, Shi Y. Zhang J, et al. Front Plant Sci. 2024 Oct 17;15:1435420. doi: 10.3389/fpls.2024.1435420. eCollection 2024. Front Plant Sci. 2024. PMID: 39483679 Free PMC article. - A proteomic study of cysteine protease induced cell death in anthers of male sterile tobacco transgenic plants.
Shukla P, Gautam R, Singh NK, Ahmed I, Kirti PB. Shukla P, et al. Physiol Mol Biol Plants. 2019 Jul;25(4):1073-1082. doi: 10.1007/s12298-019-00642-y. Epub 2019 Feb 1. Physiol Mol Biol Plants. 2019. PMID: 31402825 Free PMC article. - Selfish Mitonuclear Conflict.
Havird JC, Forsythe ES, Williams AM, Werren JH, Dowling DK, Sloan DB. Havird JC, et al. Curr Biol. 2019 Jun 3;29(11):R496-R511. doi: 10.1016/j.cub.2019.03.020. Curr Biol. 2019. PMID: 31163164 Free PMC article. Review. - Mapping genes governing flower architecture and pollen development in a double mutant population of carrot.
Budahn H, Barański R, Grzebelus D, Kiełkowska A, Straka P, Metge K, Linke B, Nothnagel T. Budahn H, et al. Front Plant Sci. 2014 Oct 8;5:504. doi: 10.3389/fpls.2014.00504. eCollection 2014. Front Plant Sci. 2014. PMID: 25339960 Free PMC article. - MADS goes genomic in conifers: towards determining the ancestral set of MADS-box genes in seed plants.
Gramzow L, Weilandt L, Theißen G. Gramzow L, et al. Ann Bot. 2014 Nov;114(7):1407-29. doi: 10.1093/aob/mcu066. Epub 2014 May 22. Ann Bot. 2014. PMID: 24854168 Free PMC article.
References
- Abad LR, D'Urzo MP, Liu D, Narasimhan ML, Reuveni M, Zhu JK, Niu X, Singh NK, Hasegawa PM, Bressan RA. Antifungal activity of tobacco osmotin has specificity and involves plasma membrane permeabilization. Plant Sci. 1996;118:11–23.
- Aguirre PJ, Smith AG. Molecular characterization of a gene encoding a cysteine-rich protein preferentially expressed in anthers of Lycopersicon esculentum. Plant Mol Biol. 1993;23:477–487. - PubMed
- Arro M, Richard L, Van K, Ferrer A, Boronat A. Cloning and characterization of a novel cDNA encoding thaumatin-like protein PR5 from Arabidopsis thaliana (accession no. ) (PGR 97-053) Plant Physiol. 1997;113:1463. - PubMed
- Atanassov I, Russinova E, Antonov L, Atanassov A. Expression of an anther-specific chalcone synthase-like gene is correlated with uninucleate microspore development in Nicotiana sylvestris. Plant Mol Biol. 1998;38:1169–1178. - PubMed
Publication types
MeSH terms
Substances
LinkOut - more resources
Full Text Sources
Other Literature Sources

