Distinct subcellular localization patterns contribute to functional specificity of the Cln2 and Cln3 cyclins of Saccharomyces cerevisiae - PubMed (original) (raw)
Distinct subcellular localization patterns contribute to functional specificity of the Cln2 and Cln3 cyclins of Saccharomyces cerevisiae
M E Miller et al. Mol Cell Biol. 2000 Jan.
Abstract
The G(1) cyclins of budding yeast drive cell cycle initiation by different mechanisms, but the molecular basis of their specificity is unknown. Here we test the hypothesis that the functional specificity of G(1) cyclins is due to differential subcellular localization. As shown by indirect immunofluorescence and biochemical fractionation, Cln3p localization appears to be primarily nuclear, with the most obvious accumulation of Cln3p to the nuclei of large budded cells. In contrast, Cln2p localizes to the cytoplasm. We were able to shift localization patterns of truncated Cln3p by the addition of nuclear localization and nuclear export signals, and we found that nuclear localization drives a Cln3p-like functional profile, while cytoplasmic localization leads to a partial shift to a Cln2p-like functional profile. Therefore, forcing Cln3p into a Cln2p-like cytoplasmic localization pattern partially alters the functional specificity of Cln3p toward that of Cln2p. These results suggest that there are CLN-dependent cytoplasmic and nuclear events important for cell cycle initiation. This is the first indication of a cytoplasmic function for a cyclin-dependent kinase. The data presented here support the idea that cyclin function is regulated at the level of subcellular localization and that subcellular localization contributes to the functional specificity of Cln2p and Cln3p.
Figures
FIG. 1
Indirect immunolocalization of Cln2p and Cln3p. (A) Strains expressing Cln2mycp from the CLN2 promoter (strain MMY1) and Cln3hamycp from the GAL1 promoter (strain MMY2). (B) Cln3hamycp from the CLN3 promoter (1255-5C with pMM45). Strains were assayed by indirect immunofluorescence as described in Materials and Methods. The first row shows DIC images (cells); the second row shows indirect immunofluorescence where monoclonal anti-myc 9E10 (Santa Cruz Biotechnology) was used as the primary antibody (α-myc), and the third row shows the DAPI staining of DNA. The myc-tagged cyclins expressed are indicated at the top of each set. The Cln2mycp signal appeared to be punctate and cytoplasmic. At a low frequency, spots of Cln2mycp signal are visible but do not lie within the area of the nucleus as defined by the DAPI stain. Nuclear Cln3-1hamycp staining was usually throughout the area of the nucleus, but on rare occasions (<0.5% of the cells with overexpressed Cln3-1hamycp) the staining appeared along the edge of the nucleus. Bar, 5 μm.
FIG. 2
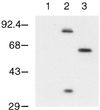
Immunoblot analysis of Cln3hamycp and Cln3-1hamycp. A wild-type strain (1255-5c) was transformed with plasmids pRS414 (vector, lane 1), pAG2 (Cln3hamycp expressed from the GAL1 promoter, lane 2), and pMM55 (Cln3-1hamycp, lane 3). All plasmids are episomal CEN (low copy number). Cellular lysates were separated by SDS–12% polyacrylamide gel electrophoresis (PAGE) and analyzed by Western blotting as described in Materials and Methods. Proteins were visualized by using the polyclonal anti-myc A-14 antibody (Santa Cruz Biotechnology). Molecular size markers are listed to the left of the blot in kilodaltons.
FIG. 3
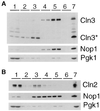
Localization of Cln3p and Cln2p by subcellular fractionation. Fractions were prepared as described in Materials and Methods. Duplicate samples of each fraction were separated by SDS–12% PAGE and analyzed by Western blotting. Fractions are indicated at the top of each blot. Fraction 1 corresponds to the crude cytoplasmic fraction, fraction 2 corresponds to the surface of the sucrose gradient, fraction 3 corresponds to the surface-2.01 M sucrose interface, fraction 4 corresponds to the 2.01 to 2.1 M sucrose interface, fraction 5 corresponds to the 2.1 to 2.3 M sucrose interface, and fraction 6 corresponds to the remaining pellet of the sucrose gradient. The total protein isolated from cells prior to polytron shearing is indicated in the lane marked 7. (A) Immunoblot analysis of fractions from a strain expressing Cln3hamycp from the GAL1 promoter (MMY2). The position of full-length Cln3hamycp is indicated by Cln3, and the 35-kDa species is indicated by Cln3*. Corresponding immunoblot analysis of the Nop1p and Pgk1p fractionation is shown below the Cln3p blot. The nucleolar protein Nop1p detected with the monoclonal antibody D77 (1) indicates which fractions contain nuclear proteins. The cytoplasmic protein Pgk1p detected with the anti-Pgk1p polyclonal antibody (Molecular Probes) indicates which fractions contain cytoplasmic proteins. (B) Immunoblot analysis of fractions from a strain expressing Cln2mycp from the CLN2 promoter (MMY1). The Cln2p, Pgk1p, and Nop1p immunoblots are shown. A moderate level of nuclear breakage apparently occurred in this fractionation, as indicated by leakage of Nop1p into the intermediate and cytosolic fractions.
FIG. 4
Indirect immunolocalization of NLS- and NES-Cln3mycp. Wild-type cells (1255-5c) were transformed with plasmids pRS414 (vector), pMM99 (Cln3mycp), pMM100 (NLS-Cln3mycp), pMM101 (mnls-Cln3mycp), pMM102 (NES-Cln3mycp), and pMM103 (mnes-Cln3mycp). All plasmids are episomal CEN (low copy number) and express the myc-tagged Cln3 protein from the CLN3 promoter. Transformants were assayed by indirect immunofluorescence as described in Materials and Methods. The first row shows DIC images (cells), the second row shows the indirect immunofluorescence with monoclonal anti-myc antibody 9E10 (α-myc), and the third row shows DAPI staining of DNA. The myc-tagged cyclins expressed are indicated at the top of each set. Bar, 5 μm.
FIG. 5
Indirect immunolocalization of NLS– and NES–Cln3-1hamycp. Wild-type cells (1255-5c) were transformed with plasmids pRS414 (vector), pMM55 (Cln3-1hamycp), pMM83 (NLS–Cln3-1hamycp), pMM84 (nmls–Cln3-1hamycp), pMM85 (NES–Cln3-1hamycp), and pMM86 (mnes–Cln3-1hamycp). All plasmids are episomal CEN (low copy number) and express the myc-tagged Cln protein from the CLN3 promoter. Transformants were assayed by indirect immunofluorescence as described in Materials and Methods. The first row shows DIC images (cells), the second row shows the indirect immunofluorescence with monoclonal anti-myc antibody 9E10 (α-myc), and the third row shows DAPI staining of DNA. The myc-tagged cyclins expressed are indicated at the top of each set. Bar, 5 μm.
FIG. 6
Comparison of myc-tagged Cln proteins. Wild-type strain (1255-5c) was transformed with plasmids pRS414 (vector, lane 1), pMM45 (Cln3, lane 2), pMM55 (Cln3-1, lane 3), pMM83 (NLS–Cln3-1, lane 4), pMM84 (mnls–Cln3-1, lane 5), pMM85 (NES–Cln3-1, lane 6), pMM86 (mnes–Cln3-1, lane 7), pMM82 (Cln2, lane 8), pMM60 (NLS-Cln2, lane 9), pMM61 (mnls-Cln2, lane 10), pMM92 (NES-Cln2, lane 11), and pMM93 (mnes-Cln2, lane 12). All plasmids are episomal CEN (low copy number) and express the myc-tagged Cln protein from the CLN3 promoter. Cellular lysates were separated by SDS–12% PAGE and analyzed by Western blotting as described in Materials and Methods.
FIG. 7
Cell size assay for CLN gene function. CLN1 cln2 cln3 cells (1421-21D) were transformed with plasmids containing various CLN2 and CLN3 constructs (see Fig. 5 legend). Cell size analysis was carried out as described in Materials and Methods. The data for three transformants are shown on each graph. The x and y axis scales for all of the graphs in this figure are identical.
FIG. 8
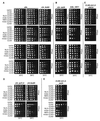
Viability assay for NLS- and NES–CLN2 and CLN3-1 strains. Mutant strains, each containing a GAL1::CLN for viability, were transformed with CLN plasmids. For each transformant strain, 10-fold serial dilutions were prepared from independent pools of transformants (5 to 10 colonies), and 3 μl of each dilution was plated onto both YPDex and YPGal plates. Plates were incubated at 30 or 38°C as indicated. CLN plasmids used are those listed in the legend to Fig. 5. (A) _cln_− and _cln− bck2_− strains. (B) _cln− swi4_− and CLN3 cln1,2− GAL::SIC1 strains. (C) _CLN3 cln1,2− clb5,6_− strain. (D) _cln− pcl1,2_− and _cln− bud2_− strains. (E) _CLN3 cln1,2− swi4_− strain.
FIG. 9
Viability assays and Western blot for NLS- and NES-CLN3 strains. (A and B) Mutant strains, each containing a GAL1::CLN for viability, were transformed with plasmids pRS414 (vector), pMM45 (CLN3), pMM83 (NLS-CLN3), pMM84 (mnls-CLN3), pMM85 (NES-CLN3), and pMM86 (mnes-CLN3). For each transformant strain, 10-fold serial dilutions were prepared from independent pools of transformants (5 to 10 colonies), and 3 μl of each dilution was plated onto both YPDex and YPGal plates. Plates were incubated at 30 or 38°C as indicated. (A) cln− pcl1,_2_− strain. (B) _cln− swi4_− strain. (C) Wild-type strain 1255-5C was transformed with the plasmids listed above. Cellular lysates from two independent transformants were prepared in parallel for each plasmid-bearing strain (except pRS414). All plasmids are episomal CEN (low copy number) and express the myc-tagged Cln protein from the CLN3 promoter. Cellular lysates were separated by SDS–10% PAGE and analyzed by Western blotting as described in Materials and Methods. Proteins were visualized by using the polyclonal anti-myc A-14 antibody (Santa Cruz Biotechnology). Lanes: 1, vector; 2, CLN3; 3, NLS-CLN3; 4, mnls-CLN3; 5, NES-CLN3; 6, mnes-CLN3. The position of full-length Cln3hamycp is indicated by Cln3, and the 35-kDa species is indicated by *Cln3.
Similar articles
- Mechanisms controlling subcellular localization of the G(1) cyclins Cln2p and Cln3p in budding yeast.
Miller ME, Cross FR. Miller ME, et al. Mol Cell Biol. 2001 Sep;21(18):6292-311. doi: 10.1128/MCB.21.18.6292-6311.2001. Mol Cell Biol. 2001. PMID: 11509671 Free PMC article. - Relationship between the function and the location of G1 cyclins in S. cerevisiae.
Edgington NP, Futcher B. Edgington NP, et al. J Cell Sci. 2001 Dec;114(Pt 24):4599-611. doi: 10.1242/jcs.114.24.4599. J Cell Sci. 2001. PMID: 11792824 - Recruitment of Cdc28 by Whi3 restricts nuclear accumulation of the G1 cyclin-Cdk complex to late G1.
Wang H, Garí E, Vergés E, Gallego C, Aldea M. Wang H, et al. EMBO J. 2004 Jan 14;23(1):180-90. doi: 10.1038/sj.emboj.7600022. Epub 2003 Dec 18. EMBO J. 2004. PMID: 14685274 Free PMC article. - Nuclear-specific degradation of Far1 is controlled by the localization of the F-box protein Cdc4.
Blondel M, Galan JM, Chi Y, Lafourcade C, Longaretti C, Deshaies RJ, Peter M. Blondel M, et al. EMBO J. 2000 Nov 15;19(22):6085-97. doi: 10.1093/emboj/19.22.6085. EMBO J. 2000. PMID: 11080155 Free PMC article. - The cyclin family of budding yeast: abundant use of a good idea.
Andrews B, Measday V. Andrews B, et al. Trends Genet. 1998 Feb;14(2):66-72. doi: 10.1016/s0168-9525(97)01322-x. Trends Genet. 1998. PMID: 9520600 Review.
Cited by
- Mechanisms controlling subcellular localization of the G(1) cyclins Cln2p and Cln3p in budding yeast.
Miller ME, Cross FR. Miller ME, et al. Mol Cell Biol. 2001 Sep;21(18):6292-311. doi: 10.1128/MCB.21.18.6292-6311.2001. Mol Cell Biol. 2001. PMID: 11509671 Free PMC article. - Functional distinction between Cln1p and Cln2p cyclins in the control of the Saccharomyces cerevisiae mitotic cycle.
Queralt E, Igual JC. Queralt E, et al. Genetics. 2004 Sep;168(1):129-40. doi: 10.1534/genetics.104.029587. Genetics. 2004. PMID: 15454532 Free PMC article. - Double-negative feedback between S-phase cyclin-CDK and CKI generates abruptness in the G1/S switch.
Venta R, Valk E, Kõivomägi M, Loog M. Venta R, et al. Front Physiol. 2012 Dec 6;3:459. doi: 10.3389/fphys.2012.00459. eCollection 2012. Front Physiol. 2012. PMID: 23230424 Free PMC article. - Molecular basis of the functional distinction between Cln1 and Cln2 cyclins.
Quilis I, Igual JC. Quilis I, et al. Cell Cycle. 2012 Aug 15;11(16):3117-31. doi: 10.4161/cc.21505. Epub 2012 Aug 14. Cell Cycle. 2012. PMID: 22889732 Free PMC article. - Degradation of Hof1 by SCF(Grr1) is important for actomyosin contraction during cytokinesis in yeast.
Blondel M, Bach S, Bamps S, Dobbelaere J, Wiget P, Longaretti C, Barral Y, Meijer L, Peter M. Blondel M, et al. EMBO J. 2005 Apr 6;24(7):1440-52. doi: 10.1038/sj.emboj.7600627. Epub 2005 Mar 17. EMBO J. 2005. PMID: 15775961 Free PMC article.
References
- Baldin V, Lukas J, Marcote M J, Pagano M, Draetta G. Cyclin D1 is a nuclear protein required for cell cycle progression in G1. Genes Dev. 1993;7:812–821. - PubMed
- Cardosa M C, Leonhardt H, Nada-Ginard B. Reversal of terminal differentiation and control of DNA replication cyclin A and Cdk2 specifically localize at subnuclear sites of DNA replication. Cell. 1993;74:979–992. - PubMed
- Chant J, Corrado K, Pringle J R, Herskowitz I. Yeast BUD5, encoding a putative GDP-GTP exchange factor, is necessary for bud site selection and interacts with bud formation gene BEM1. Cell. 1991;65:1213–1224. - PubMed
Publication types
MeSH terms
Substances
LinkOut - more resources
Full Text Sources
Molecular Biology Databases
Research Materials


