The polarity and dynamics of microtubule assembly in the budding yeast Saccharomyces cerevisiae - PubMed (original) (raw)
The polarity and dynamics of microtubule assembly in the budding yeast Saccharomyces cerevisiae
P S Maddox et al. Nat Cell Biol. 2000 Jan.
Abstract
Microtubule assembly in Saccharomyces cerevisiae is initiated from sites within spindle pole bodies (SPBs) in the nuclear envelope. Microtubule plus ends are thought to be organized distal to the SPBs, while minus ends are proximal. Several hypotheses for the function of microtubule motor proteins in force generation and regulation of microtubule assembly propose that assembly and disassembly occur at minus ends as well as at plus ends. Here we analyse microtubule assembly relative to the SPBs in haploid yeast cells expressing green fluorescent protein fused to alpha-tubulin, a microtubule subunit. Throughout the cell cycle, analysis of fluorescent speckle marks on cytoplasmic astral microtubules reveals that there is no detectable assembly or disassembly at minus ends. After laser-photobleaching, metaphase spindles recover about 63% of the bleached fluorescence, with a half-life of about 1 minute. After anaphase onset, photobleached marks in the interpolar spindle are persistent and do not move relative to the SPBs. In late anaphase, the elongated spindles disassemble at the microtubule plus ends. These results show for astral and anaphase interpolar spindle microtubules, and possibly for metaphase spindle microtubules, that microtubule assembly and disassembly occur at plus, and not minus, ends.
Figures
Figure 1. FSM of an astral microtubule during the G1/S phase of the cell cycle
a, A single image of a G1/S-phase cell expressing GFP–tubulin, taken from a time-lapse experiment. The large arrowhead marks a bright fluorescent speckle, and the arrow marks the SPB. b, A kymograph (see Methods) of the microtubule shown in a. The kymograph shows that the distance between the SPB (arrow) and the tip of the microtubule at the cell cortex elongates and shortens over time, whereas the distance from the centre of the fluorescent speckle (large arrowhead) to the SPB remains constant. These distances are plotted in c. Squares indicate the distance from the SPB to the speckle, and triangles indicate the distance from the SPB to the tip of the microtubule, plotted against time. Scale bar in a represents 2 μm, and in b represents 20 s. Note that the apparent changes in width of the indicated speckle region (arrowhead) over time are caused by loss of contrast resulting from photobleaching and fluctuations in focus.
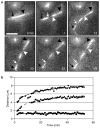
Figure 2. FSM of an astral microtubule during anaphase
a, Selected frames from time-lapse observation of an anaphase cell expressing GFP–tubulin. The arrow marks the SPB and the arrowhead marks a speckle in the dynamic astral microtubule; the tip of the microtubule is in contact with the cortex to the right. The microtubule elongates (time points 41 s to 59 s) and then shortens (time points 59 s to 122 s) while the speckle remains a constant distance from the SPB. b, Microtubule growth and shortening (triangles) are plotted against time, as is the distance between the indicated speckle and SPB (squares). Scale bar represents 2 μm.
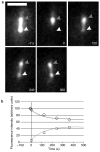
Figure 3. Partial fluorescence recovery after laser photobleaching of the metaphase spindle
a, A metaphase spindle in a cell expressing GFP–tubulin that was photobleached in the lower half-spindle and then observed by time-lapse microscopy. The −7 s time point shows the spindle before photobleaching. The laser was targeted to the lower half of the spindle (white arrowhead), which was exposed to the laser for 25 ms. Time point 0 shows that the upper half-spindle is still fluorescent (grey arrowhead) while the lower half has been bleached. Time-lapse analysis for 20 min revealed that the bleached portion of the spindle recovered fluorescence (white arrowhead), while the unbleached portion lost intensity, because of photobleaching by fluorescent exposures for image acquisition and incorporation of bleached tubulin subunits. Time points are given in seconds. b, The graph shows integrated intensity measurements of a 5 pixel × 5 pixel square placed over the bleached region (squares) and the unbleached region (diamonds) over time. These values are corrected for photobleaching that occurred during time-lapse image acquisition; a decrease from the initial value of ~20% had occurred by the 360-s time point. Also plotted are the predicted rates of FRAP for bleached (grey line) and unbleached (black line) half-spindles. These theoretical values were derived using the first-order rate constant k, calculated as described in Methods. Scale bar in a represents 2 μm.
Figure 4. Time-lapse observation of an anaphase spindle after laser photobleaching
a, The time point 0 min shows a GFP–tubulin-expressing cell at the 4-μm stage of anaphase spindle elongation. The laser was targeted midway between the SPBs (indicated by the black arrow and arrowhead), to the overlapping spindle microtubules; time point 1 min shows the same spindle after laser exposure of 25-ms duration. The left and right margins of the bleach are marked by the white arrow and arrowhead, respectively. After 13 min, the photobleached mark has split into two marks as the overlapping microtubules slid past each other while the spindle continued to elongate. b, The distance between the two SPBs (diamonds), the distance between the left margin of the original mark and the lower SPB (white arrow to black arrow, squares) and the distance from the right margin of the original mark to the lower SPB (white arrowhead to black arrow, triangles) are plotted against time. Scale bar in a represents 4 μm.
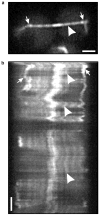
Figure 5. FSM of a late-anaphase spindle
a, A GFP–tubulin-expressing cell in late anaphase. Arrows mark the SPBs, and the arrowhead marks a selected fluorescent speckle. The entire spindle oscillates left and right; however, the kymograph in b shows that the speckles, exemplified by the indicated speckle (arrowhead), do not move relative to the SPBs. Dark areas in the kymograph are caused by focal shifts during the time-lapse experiment. The bright region in the middle of the spindle is the site of overlap of the 2–4 spindle microtubules from either pole. Scale bar in a represents 2 μm, and in b represents 20 s.
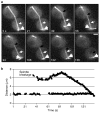
Figure 6. FSM of spindle disassembly in telophase
a, Time-lapse FSM of a telophase cell expressing GFP–tubulin. The large arrow marks the SPB and the small white arrow marks a fluorescent speckle in the spindle microtubules. The distance from the speckle to the SPB remains constant over time as the spindle kinks and then disassembles (black arrow). b, The distances between the SPB and the speckle (triangles), and between the SPB and the microtubule tip (squares), are plotted against time. The free end of the lower half-spindle elongated after losing contact with the upper half-spindle, as can be seen in the graph. Scale bar in a represents 2 μm.
Similar articles
- Microtubule dynamics from mating through the first zygotic division in the budding yeast Saccharomyces cerevisiae.
Maddox P, Chin E, Mallavarapu A, Yeh E, Salmon ED, Bloom K. Maddox P, et al. J Cell Biol. 1999 Mar 8;144(5):977-87. doi: 10.1083/jcb.144.5.977. J Cell Biol. 1999. PMID: 10085295 Free PMC article. - Astral microtubule dynamics in yeast: a microtubule-based searching mechanism for spindle orientation and nuclear migration into the bud.
Shaw SL, Yeh E, Maddox P, Salmon ED, Bloom K. Shaw SL, et al. J Cell Biol. 1997 Nov 17;139(4):985-94. doi: 10.1083/jcb.139.4.985. J Cell Biol. 1997. PMID: 9362516 Free PMC article. - A switch in microtubule dynamics at the onset of anaphase B in the mitotic spindle of Schizosaccharomyces pombe.
Mallavarapu A, Sawin K, Mitchison T. Mallavarapu A, et al. Curr Biol. 1999 Dec 2;9(23):1423-6. doi: 10.1016/s0960-9822(00)80090-1. Curr Biol. 1999. PMID: 10607565 - Factors that Control Mitotic Spindle Dynamics.
Fraschini R. Fraschini R. Adv Exp Med Biol. 2017;925:89-101. doi: 10.1007/5584_2016_74. Adv Exp Med Biol. 2017. PMID: 27722958 Review. - Role of NuMA in vertebrate cells: review of an intriguing multifunctional protein.
Sun QY, Schatten H. Sun QY, et al. Front Biosci. 2006 Jan 1;11:1137-46. doi: 10.2741/1868. Front Biosci. 2006. PMID: 16146802 Review.
Cited by
- Conserved and divergent features of kinetochores and spindle microtubule ends from five species.
McIntosh JR, O'Toole E, Zhudenkov K, Morphew M, Schwartz C, Ataullakhanov FI, Grishchuk EL. McIntosh JR, et al. J Cell Biol. 2013 Feb 18;200(4):459-74. doi: 10.1083/jcb.201209154. J Cell Biol. 2013. PMID: 23420873 Free PMC article. - The composition, functions, and regulation of the budding yeast kinetochore.
Biggins S. Biggins S. Genetics. 2013 Aug;194(4):817-46. doi: 10.1534/genetics.112.145276. Genetics. 2013. PMID: 23908374 Free PMC article. Review. - Quantitative analysis of an anaphase B switch: predicted role for a microtubule catastrophe gradient.
Cheerambathur DK, Civelekoglu-Scholey G, Brust-Mascher I, Sommi P, Mogilner A, Scholey JM. Cheerambathur DK, et al. J Cell Biol. 2007 Jun 18;177(6):995-1004. doi: 10.1083/jcb.200611113. J Cell Biol. 2007. PMID: 17576796 Free PMC article. - Modular coherence of protein dynamics in yeast cell polarity system.
Gao JT, Guimerà R, Li H, Pinto IM, Sales-Pardo M, Wai SC, Rubinstein B, Li R. Gao JT, et al. Proc Natl Acad Sci U S A. 2011 May 3;108(18):7647-52. doi: 10.1073/pnas.1017567108. Epub 2011 Apr 18. Proc Natl Acad Sci U S A. 2011. PMID: 21502521 Free PMC article. - The mating-specific Galpha interacts with a kinesin-14 and regulates pheromone-induced nuclear migration in budding yeast.
Zaichick SV, Metodiev MV, Nelson SA, Durbrovskyi O, Draper E, Cooper JA, Stone DE. Zaichick SV, et al. Mol Biol Cell. 2009 Jun;20(12):2820-30. doi: 10.1091/mbc.e09-01-0069. Epub 2009 Apr 22. Mol Biol Cell. 2009. PMID: 19386762 Free PMC article.
References
- Hoyt MA, Geiser JR. Genetic analysis of the mitotic spindle. Annu Rev Genet. 1996;30:7–33. - PubMed
- Saunders WS. Action at the ends of microtubules. Curr Opin Cell Biol. 1999;11:129–133. - PubMed
Publication types
MeSH terms
Substances
Grants and funding
- GM32238/GM/NIGMS NIH HHS/United States
- R01 GM032238/GM/NIGMS NIH HHS/United States
- R37 GM032238/GM/NIGMS NIH HHS/United States
- R37 GM024364/GM/NIGMS NIH HHS/United States
- R01 GM024364/GM/NIGMS NIH HHS/United States
- GM24364/GM/NIGMS NIH HHS/United States
LinkOut - more resources
Full Text Sources
Molecular Biology Databases


