Dependence of GABAergic synaptic areas on the interneuron type and target size - PubMed (original) (raw)
Dependence of GABAergic synaptic areas on the interneuron type and target size
Y Kubota et al. J Neurosci. 2000.
Abstract
In the neostriatum, several types of interneuron with distinct firing patterns and expression of neuroactive substances are known to exist. We found two types of neostriatal interneurons, parvalbumin-containing fast-spiking (FS) cells and somatostatin-containing low-threshold spike (LTS) cells to both be immunoreactive for GABA at their axon terminals in immersion-fixed brain slices from rat. To reveal the differences in synaptic connections between these two types of GABAergic interneurons, the postsynaptic target and their synaptic structure were compared by three-dimensional reconstructions from electron microscopic images of intracellularly stained axon terminals. FS cells made a greater proportion of synaptic contacts onto somata than LTS cells. Although terminal boutons of FS and LTS cells were similar in volume, their synaptic junctional areas differed in size distribution and relation to the dimensions of postsynaptic dendritic shafts or spines. Whereas the synaptic junctional areas of FS cells (0.024-0.435 microm(2); n = 28) sharply and linearly increased with the circumference of the postsynaptic dendrites or spines (0.939-5.146 microm), the slope for the junctional area of LTS cells (0.02-0.103 microm(2); n = 29) against circumference (0.844-4.252 microm) was less steep, and a much weaker correlation was seen. In addition to the differences in firing patterns, expressed molecules, axonal arborizations, and postsynaptic targets, this variation in dependency of the synaptic area on the target size suggests functional differentiation of GABAergic interneurons.
Figures
Fig. 1.
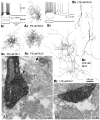
Physiological characterization and GABA-immunoreactive terminals of two neostriatal interneuron types. The somata and dendrites are shown in black and the axons in_gray_. A, FS cells.A 1 , An FS cell with hyperpolarized resting potential (r.p.), which rapidly, but transiently, fired short-duration spikes with a constant interspike interval when depolarized with a current pulse. Firing sometimes resumed during the depolarization._A2–A4,_Three FS cells used for electron microscopic studies. They have restricted dendritic fields and axons densely collateralizing in the dendritic field. A5, An identified axon terminal of FS cell number 1 making a symmetrical synapse with a dendritic shaft (large open arrow). The terminal is immunoreactive for GABA as shown by the presence of 15 nm colloidal gold particles. Strongly (filled arrows) and very weakly labeled neural elements (small open arrows) are apparent beside the FS cell terminal.B, LTS cells. _B1,An LTS cell with depolarized resting potentials (r.p.) and high input resistances. Two potential responses are shown superposed for the injected currents shown in the bottom traces (scales as in_A 1). Note that the cell fired a low-threshold spike after cessation of a hyperpolarization pulse.B2–B4, Three LTS cells used for electron microscopic observation. They have less compact dendritic arborization, often running long distances without branching or turning. The axons are also diffusely distributed, and the entire axonal field extends as far as 1000 μm. B5, An identified axon terminal of LTS cell number 1 making a symmetrical synapse with a dendritic shaft (open arrow). This terminal is also immunoreactive for GABA, as shown by the 15 nm colloidal gold particles. Scale bars:A2–A4,B2–B4, 100 μm;A5, B5, 0.5 μm.
Fig. 2.
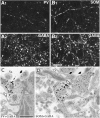
GABA immunoreactivity of parvalbumin- or somatostatin-containing fibers in immersion-fixed slices.A, Laser confocal images of the same section stained by double immunofluorescence for parvalbumin_(A_ 1 ) and GABA_(A2). Most parvalbumin-positive fibers show GABA immunoreactivity (arrowheads).B, Laser confocal images of the same section for somatostatin (B1) and GABA(B2)_ immunofluorescence. Many somatostatin-immunoreactive fibers are GABA-positive (arrowheads). Scale bar, 20 μm. C,D, Double immunolabeled ultrathin sections. A parvalbumin-immunoreactive axon terminal (C, large open arrow) and a somatostatin-immunoreactive axon (D, large open arrow) labeled with intensified gold particles (arrows) are immunoreactive for GABA, as indicated by the 15 nm colloidal gold particles. Neural elements with many colloidal gold particles (thick filled arrows) and with very few or no particles (small open arrows) are present. Scale bar, 0.5 μm.
Fig. 3.
Densities of colloidal gold particles on postembedding GABA immunoreactions at the axonal boutons of interneuron types. A, The distributions of particle density for GABA at the FS, LTS, and LA cell boutons identified physiologically and stained with DAB. Control boutons not stained intracellularly and free of DAB reaction products could be divided into two groups with the densities for GABA from 0 to 34.6 particles/μm2 and from 61.3 to 420.4 particles/μm2. The former were assumed to be non-GABAergic and the latter to be GABAergic.B, The distributions of particle densities for GABA at parvalbumin (PV)- and somatostatin (SOM)-containing boutons identified with silver-intensified gold particles at pre-embedding immunohistochemistry. Control boutons not stained by pre-embedding immunohistochemistry and free of silver-intensified gold particles could be divided into two groups with densities for GABA from 0 to 27.7 particles/μm2 and from 50.4 to 335.6 particles/μm2. Arrows indicate mean values for non-GABAergic (non-GABA mean) and GABAergic (GABA mean) boutons and for boutons of each cell type (mean).
Fig. 4.
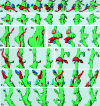
Three-dimensional analysis of terminals of FS (A–C) and LTS (D–F) cells. In_B_ 1 , C1, C2, D1, D2, and E1, two images are shown for stereoscopic observation. A1, 3-D reconstruction images of a terminal of FS cell number 1 and associated structures are rotated ∼25° each from left to right. An intracellularly labeled axon terminal of the FS cell (red) makes a symmetrical synapse on a postsynaptic spiny dendrite (green). Two of the spine heads receive asymmetrical synapses (blue and dark blue). The other terminal (pink) makes a symmetrical contact on the other side of the dendrite. A2, The same dendrite as in A1 is rotated in the same way except that synaptic junctions are indicated by the same colors as the terminal boutons in A1. The synaptic junctional area of the FS cell terminal (red) was 0.298 μm2. B1, Two successive axonal boutons of FS cell number 1 make synaptic junctions 0.8 μm apart on the same proximal dendrite 2 μm distant from the soma. Two synaptic junctions are shown in_B2_ at the same magnification as in_A_. The synaptic junctional areas of the FS cell terminals were 0.19 (left) and 0.18 μm2(right), respectively.C1, Another axon terminal (red) of FS cell number 1 makes a symmetrical synaptic contact on a spine neck. The spine receives an asymmetrical terminal on the head (dark blue) and another spine also an asymmetrical terminal (blue). Another terminal (orange) makes a symmetrical synapse on the dendritic shaft.C2, The same dendrite as in_C1_ except that synaptic junctions are indicated by the same colors as the terminal boutons in_C1_. The synaptic junctional area of the FS cell terminal (red) was 0.04 μm2.D1, A terminal of LTS cell number 1 (red) makes a symmetrical synaptic contact on a shaft of a spiny dendrite (green).D2, The synaptic junctional area (0.088 μm2) is indicated by red. E1, A terminal of LTS cell number 2 (red) makes a symmetrical synaptic junction on a trunk of a spiny dendrite (green). Two spines nearby receive asymmetrical synaptic terminals on the head (blue).E2, The synaptic junctional area (0.068 μm2) is indicated by red. F1, A terminal of LTS cell number 1 and associated structures are rotated ∼30° from left to right. The terminal (red) makes a symmetrical synaptic contact on a spine stalk. The spine head receives an asymmetrical terminal (dark blue) and other three spines, also asymmetrical terminals (blue), on the head.F2, The same dendrite as in_F1_ is rotated in the same way, except that synaptic junctions are indicated by the same colors as the terminal boutons in F1. The synaptic junctional area of the terminal (red) was 0.068 μm2. Scale bars: A,_B_2, C–F, 0.5 μm;B1, 0.8 μm.
Fig. 5.
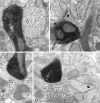
Electron micrographs showing symmetrical synapses of axon terminals used for 3-D reconstructions. A,B, The symmetrical synapses in Figure 4, A and_C_ (FS cell number 1), on the dendritic shaft (open arrow) and on the spine neck (open arrow), respectively. B, Filled arrow, An asymmetrical synapse on the spine head. C, D, The symmetrical synapses in Figure 4, D and F (LTS cell number 1), on the dendritic shaft (open arrow) and on the spine neck (open arrow), respectively. D, Filled arrow, An asymmetrical synapse on the spine head.D, Double arrows, A spine apparatus. Scale bar, 0.5 μm.
Fig. 6.
Synaptic junction areas and volumes for terminal boutons of FS cells (A) and LTS cells (B). A 1 , B1, Distributions of synaptic junction areas of FS and LTS cell terminals. The junctional areas of synapses onto dendrites of FS cells are more variable than for LTS cells, with values of 0.024–0.435 μm2, as opposed to <0.103 μm2. Similar size variation was seen for the junctional areas onto somata of FS (0.044–0.514 μm2), but a larger junctional area (0.361 μm2) was found for a somatic synapse of the LTS cell. Synapses on somata are shown in black, and on dendrites in gray. A2, B2, Relationship between synaptic junction area and terminal bouton volume (gray circles on dendrites; black triangles on somata) for FS and LTS cells. The bouton volumes of FS and LTS cell terminals are distributed similarly. No correlation was found between bouton volume and junctional area.
Fig. 7.
A, Relationship of the synaptic junction area to target structure circumference for three FS and three LTS cells. The data were obtained from the 3-D reconstructions of serial ultrathin sections. Synapses on dendritic shafts are represented by filled symbols and on spine necks by open symbols. Each solid line is a simple regression fit to a set of data. A 1 , The data point indicated by the curved arrow (red) is the sum of two synapses from the same FS cell 0.8 μm apart on the same target dendrite (shown in Fig. 4_B_). Correlation coefficients and slopes (regression coefficients) for the regression lines were: FS cell number 1 (n = 13; red circles), 0.97 and 0.084 μm (p < 0.0001; ANOVA test); FS cell number 2 (n = 5;blue triangles), 0.99 and 0.087 μm (p = 0.0005); FS cell number 3 (n = 9; green squares), 0.99 and 0.095 μm (p < 0.0001).A2, Regression fits for the LTS cells showed a much less steep slope than for the FS cells and a greater spread in the data. Correlation coefficients and slopes for these cells were: LTS cell number 1 (n = 9;pink diamonds), 0.49 and 0.014 μm (p = 0.1818); LTS cell number 2 (n = 12; brown inverted triangles), 0.75 and 0.022 μm (p = 0.0047); LTS cell number 3 (n = 8; blue circles), 0.58 and 0.009 μm (p = 0.1304).B, 3-D reconstruction images of postsynaptic dendrites (green) of FS (B1) and LTS cells (B 2). The area of the synaptic junctions (red) of the FS cells clearly increased with the size of the postsynaptic structures, whereas those of the LTS cells did not increase sharply. Scale bar, 0.5 μm.
Fig. 8.
Schematic view of synaptic connections of GABAergic FS and LTS cells of the rat neostriatum. In FS cells, the synaptic junctional area (red regions in the terminal boutons) sharply and linearly increases with the circumference of the postsynaptic dendrite or spine. Those of the LTS cells (blue regions in the terminal boutons) demonstrate a less pronounced increment in size. NO, Nitric oxide;PV, parvalbumin; SOM, somatostatin.
Similar articles
- Neurochemical features and synaptic connections of large physiologically-identified GABAergic cells in the rat frontal cortex.
Kawaguchi Y, Kubota Y. Kawaguchi Y, et al. Neuroscience. 1998 Aug;85(3):677-701. doi: 10.1016/s0306-4522(97)00685-4. Neuroscience. 1998. PMID: 9639265 - Physiological, morphological, and histochemical characterization of three classes of interneurons in rat neostriatum.
Kawaguchi Y. Kawaguchi Y. J Neurosci. 1993 Nov;13(11):4908-23. doi: 10.1523/JNEUROSCI.13-11-04908.1993. J Neurosci. 1993. PMID: 7693897 Free PMC article. - Synaptic input and output of parvalbumin-immunoreactive neurons in the neostriatum of the rat.
Bennett BD, Bolam JP. Bennett BD, et al. Neuroscience. 1994 Oct;62(3):707-19. doi: 10.1016/0306-4522(94)90471-5. Neuroscience. 1994. PMID: 7870301 - Parvalbumin, somatostatin and cholecystokinin as chemical markers for specific GABAergic interneuron types in the rat frontal cortex.
Kawaguchi Y, Kondo S. Kawaguchi Y, et al. J Neurocytol. 2002 Mar-Jun;31(3-5):277-87. doi: 10.1023/a:1024126110356. J Neurocytol. 2002. PMID: 12815247 Review. - GABAergic inhibition in the neostriatum.
Wilson CJ. Wilson CJ. Prog Brain Res. 2007;160:91-110. doi: 10.1016/S0079-6123(06)60006-X. Prog Brain Res. 2007. PMID: 17499110 Review.
Cited by
- Dysbindin-1, BDNF, and GABAergic Transmission in Schizophrenia.
Jun R, Zhang W, Beacher NJ, Zhang Y, Li Y, Lin DT. Jun R, et al. Front Psychiatry. 2022 Jun 22;13:876749. doi: 10.3389/fpsyt.2022.876749. eCollection 2022. Front Psychiatry. 2022. PMID: 35815020 Free PMC article. Review. - The microcircuits of striatum in silico.
Hjorth JJJ, Kozlov A, Carannante I, Frost Nylén J, Lindroos R, Johansson Y, Tokarska A, Dorst MC, Suryanarayana SM, Silberberg G, Hellgren Kotaleski J, Grillner S. Hjorth JJJ, et al. Proc Natl Acad Sci U S A. 2020 Apr 28;117(17):9554-9565. doi: 10.1073/pnas.2000671117. Epub 2020 Apr 22. Proc Natl Acad Sci U S A. 2020. PMID: 32321828 Free PMC article. - Editorial: Electron-Microscopy-Based Tools for Imaging Cellular Circuits and Organisms.
Kubota Y. Kubota Y. Front Neural Circuits. 2019 Oct 11;13:64. doi: 10.3389/fncir.2019.00064. eCollection 2019. Front Neural Circuits. 2019. PMID: 31680878 Free PMC article. No abstract available. - Control of excitatory hierarchical circuits by parvalbumin-FS basket cells in layer 5 of the frontal cortex: insights for cortical oscillations.
Kawaguchi Y, Otsuka T, Morishima M, Ushimaru M, Kubota Y. Kawaguchi Y, et al. J Neurophysiol. 2019 Jun 1;121(6):2222-2236. doi: 10.1152/jn.00778.2018. Epub 2019 Apr 17. J Neurophysiol. 2019. PMID: 30995139 Free PMC article. Review. - Dopaminergic modulation of striatal function and Parkinson's disease.
Zhai S, Shen W, Graves SM, Surmeier DJ. Zhai S, et al. J Neural Transm (Vienna). 2019 Apr;126(4):411-422. doi: 10.1007/s00702-019-01997-y. Epub 2019 Apr 1. J Neural Transm (Vienna). 2019. PMID: 30937538 Free PMC article. Review.
References
- Bennett BD, Bolam JP. Synaptic input and output of parvalbumin-immunoreactive neurons in the neostriatum of the rat. Neuroscience. 1994;62:707–719. - PubMed
- Bolam JP, Bennet BD. Microcircuitry of the neostriatum. In: Arino M, Surmeier D, editors. Molecular and cellular mechanism of neostriatal function. R.G. Landes; Austin: 1995. pp. 1–19.
- Buhl E, Halasy K, Somogyi P. Diverse sources of hippocampal unitary inhibitory postsynaptic potentials and the number of synaptic release sites. Nature. 1994;368:823–828. - PubMed
Publication types
MeSH terms
Substances
LinkOut - more resources
Full Text Sources
Miscellaneous


