Epithelial mesenchymal transition by c-Fos estrogen receptor activation involves nuclear translocation of beta-catenin and upregulation of beta-catenin/lymphoid enhancer binding factor-1 transcriptional activity - PubMed (original) (raw)
Epithelial mesenchymal transition by c-Fos estrogen receptor activation involves nuclear translocation of beta-catenin and upregulation of beta-catenin/lymphoid enhancer binding factor-1 transcriptional activity
A Eger et al. J Cell Biol. 2000.
Abstract
Mouse mammary epithelial cells expressing a fusion protein of c-Fos and the estrogen receptor (FosER) formed highly polarized epithelial cell sheets in the absence of estradiol. Beta-catenin and p120(ctn) were exclusively located at the lateral plasma membrane in a tight complex with the adherens junction protein, E-cadherin. Upon activation of FosER by estradiol addition, cells lost epithelial polarity within two days, giving rise to a uniform distribution of junctional proteins along the entire plasma membrane. Most of the beta-catenin and p120(ctn) remained in a complex with E-cadherin at the membrane, but a minor fraction of uncomplexed cytoplasmic beta-catenin increased significantly. The epithelial-mesenchymal cell conversion induced by prolonged estradiol treatment was accompanied by a complete loss of E-cadherin expression, a 70% reduction in beta-catenin protein level, and a change in the expression pattern of p120(ctn) isoforms. In these mesenchymal cells, beta-catenin and p120(ctn) were localized in the cytoplasm and in defined intranuclear structures. Furthermore, beta-catenin colocalized with transcription factor LEF-1 in the nucleus, and coprecipitated with LEF-1-related proteins from cell extracts. Accordingly, beta-catenin- dependent reporter activity was upregulated in mesenchymal cells and could be reduced by transient expression of exogenous E-cadherin. Thus, epithelial mesenchymal conversion in FosER cells may involve beta-catenin signaling.
Figures
Figure 1
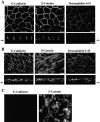
Immunolocalization of junctional proteins in polarized epithelial cell sheets of FosER cells and redistribution upon estradiol treatment. Polarized FosER cells grown on filters in the absence of estradiol (A), cells treated with estradiol for 4 d (B), or mesenchymal FosER cells obtained after estradiol treatment for 14 d (C) were processed for immunofluorescence microscopy using antibodies to junctional proteins as indicated. Confocal images of horizontal (large panels) and vertical (small panels) optical sections through cell layers are shown. Arrows next to vertical sections indicate position of filter. Bars, 10 μm.
Figure 2
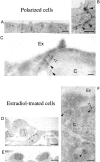
Ultrastructural analysis of polarized FosER cells (A–C) and estradiol-treated cells (D–F). Untreated polarized FosER cells (A–C), FosER cells treated with estradiol for 4 d (D), or mesenchymal cells after 14-d estradiol treatment (E and F) were fixed, embedded in epoxy resins, and ultrathin sections were analyzed by transmission EM (A, B, D, and E); or cells were frozen in liquid nitrogen and cryosections were processed for immunoelectron microscopy (C and F) using antibodies to β-catenin (filled arrowheads) and p120ctn (open arrowheads). C, Cytoplasm; Ex, extracellular space. Bars: (A, D, and E) 10 μm; (B) 500 nm; (C and F) 100 nm.
Figure 3
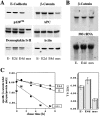
Protein expression levels of junctional proteins (A), and β-catenin mRNA levels (B) and β-catenin turnover rates (C) during various stages of estradiol treatment. A, Equivalent amounts of total cell lysates of untreated polarized FosER cells (E−), cells treated with estradiol for 2 d (E2d) and 4 d (E4d), and mesenchymal FosER cells after 14-d estradiol treatment (mes) were analyzed by immunoblotting using antibodies to indicated proteins. B, Northern blot analysis of total RNA from these cells probed with β-catenin cDNA fragment and with 28S rRNA oligo as a control for equal loading. C, Cells were metabolically labeled with [35S]methionine and chased in unlabeled medium for 1–7 h. β-Catenin was immunoprecipitated from cell lysates and analyzed by SDS-PAGE and autoradiography. The specific β-catenin label was determined by counting radioactivity in the β-catenin band in a scintillation counter. Values were normalized for protein content, determined by densitometric scanning of Coomassie stained gel bands, and plotted against the chase time in a semilogarithmic graph. Best linear curve fits were made from values between 2- and 7-h chase time (one particular experiment is shown), and half-lives (T1/2) were calculated from triplicate analyses (bar graph). Mean values and SD were: E−, 5.64 h, SD = 0.56; E4d, 7.35 h, SD = 0.84; and mes, 2.37 h, SD = 0.38.
Figure 4
Analysis of the E-cadherin–independent pool of β-catenin and of β-catenin complexes in polarized and estradiol-treated FosER cells. A, Untreated FosER cells (E−), and cells treated with estradiol for 2 d (E2d), and 4 d (E4d), and mesenchymal FosER cells after 14-d estradiol treatment (mes) were lysed in detergent-free buffer and soluble (S) and insoluble (P) cell fractions were obtained by centrifugation of total cell lysates at 30,000 g for 20 min. B, Cells were lysed in buffers without (−TX-100) or with (+TX-100) Triton X-100 and β-catenin was immunoprecipitated from the soluble cell fractions. Immunoblots of cell fractions and of β-catenin immunoprecipitates using antibodies to indicated proteins are shown.
Figure 5
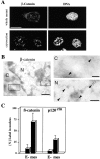
Nuclear localization of β-catenin and p120ctn after EMT. A, Mesenchymal FosER cells after 14-d estradiol treatment (whole-mount) or cryosections obtained from these cells were processed for immunofluorescence microscopy using antibodies to β-catenin and the DNA stain propidium iodide. Double fluorescence confocal images are shown. Bar, 10 μm. B, Cryosections of mesenchymal FosER cells were processed for immunoelectron microscopy using antibodies to β-catenin. Low magnifications (left) and higher magnifications (right) of indicated areas are shown. Arrowheads denote gold label. C, cytoplasm, N, nucleus. Bars: (left) 500 nm; (right) 100 nm. C, Semiquantitative analyses of the relative amount of β-catenin- and p120ctn-specific label in the nucleus versus cytoplasm in polarized epithelial (E−) and mesenchymal (mes) FosER cells. The number of gold particles was counted in equivalent areas of the cytoplasm and the nucleus and the percentage of nuclear particles was calculated. Data represent statistical mean values of 50 counted samples. Mean values and SD were: β-catenin, E− (10%, SD = 10), mes (70%, SD = 20); and p120ctn, E− (5% SD = 4), mes (30% SD = 10).
Figure 6
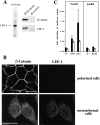
Formation of a transcriptionally active β-catenin/LEF-1 complex in mesenchymal FosER cells after 14-d estrogen treatment. A, Mesenchymal FosER cells were lysed in buffer containing Triton X-100 and DNase, and β-catenin was immunoprecipitated from the soluble cell fraction. Control immunoprecipitates were obtained with an unrelated mouse IgG. Immunoblots of the total cell lysate using affinity-purified antiserum to LEF-1 and relevant areas of immunoblots of the β-catenin (IP-β-catenin) and control (IP-control) immunoprecipitates using antibodies to β-catenin and LEF-1 are shown. B, Polarized or mesenchymal FosER cells were treated for immunofluorescence microscopy using an mAb to β-catenin and an affinity-purified antibody to LEF-1. Confocal double immunofluorescence images are shown. Bar, 10 μm. C, Polarized epithelial (E−), 4-d estradiol-treated (E4d) and mesenchymal (mes) FosER cells after 14-d estradiol treatment, or polarized (E−) and 14-d estradiol-treated JunER cells were transiently transfected with TOPFLASH luciferase reporter plasmid containing multimerized LEF-1/TCF binding sites (filled bars) or mutated FOPFLASH plasmid (open bars). The level of luciferase activity was normalized for the expression of a cotransfected CMV–β-galactosidase expression plasmid. Fold activation was quantitated relative to the level of luciferase activity from polarized FosER and JunER cells, respectively. All experiments were performed three to five times. Mean values and SD were: FosER cells/TOPFLASH, E− (1.0); E4d (3.28, SD = 0.87); mes (7.23, SD = 3.36); FosER cells/FOPFLASH, E− (0.7, SD = 0.15); E4d (2.5, SD = 0.20); mes (2.7, SD = 0.20); JunER cells/TOPFLASH cells, E− (1.0); E14d (1.23, SD = 0.18); and JunER cells/FOPFLASH, E− (0.60, SD = 0.2); E14d (0.73, SD = 0.13).
Figure 7
Dependence of β-catenin/LEF-1 transcriptional activity on ectopic expression of E-cadherin, wild-type and mutated β-catenin, and LEF-1. Mesenchymal (filled bars) and polarized epithelial (open bars) FosER cells were transiently transfected with TOPFLASH luciferase reporter plasmid, together with increasing amounts of expression plasmids (2–10 μg) encoding E-cadherin or expression plasmids encoding myc-tagged β-catenin, stable, mutated β-catenin*, or expression plasmids encoding HA-tagged LEF-1 alone or in combination with mutated β-catenin (β-cat*). The level of luciferase activity was normalized for the expression of a cotransfected CMV–β-galactosidase expression plasmid. Luciferase activities relative to controls obtained by cotransfections with empty expression vectors are shown. Experiments were repeated at least twice for each E-cadherin expression study and at least three times for all others. Means and SD were: for E-cad/mes, 2 μg (0.88, SD = 0.02); 5 μg (0.72, SD = 0.01); 10 μg (0.60, SD = 0.13); for Ecad/pol, 2 μg (0.14, SD = 0.01); 5 μg (0.13, SD = 0.01); 10 μg (0.08, SD = 0.03); for βcat/mes (1.35, SD = 0.25); βcat*/mes (2.05, SD = 0.35); βcat/pol (0.11, SD = 0.02); βcat* (0.16, SD = 0.02); for LEF-1 (7.85, SD = 0.35); and LEF+βcat* (16.35, SD = 0.35). Experiments were also performed once with mutated FOPFLASH plasmid, showing no significant effect upon ectopic protein expression. The expression of ectopic proteins is shown by immunoblot analyses of total cell lysates of transfected mesenchymal cells using antibodies to E-cadherin, β-catenin, and the HA tag.
Similar articles
- beta-Catenin and TGFbeta signalling cooperate to maintain a mesenchymal phenotype after FosER-induced epithelial to mesenchymal transition.
Eger A, Stockinger A, Park J, Langkopf E, Mikula M, Gotzmann J, Mikulits W, Beug H, Foisner R. Eger A, et al. Oncogene. 2004 Apr 8;23(15):2672-2680. doi: 10.1038/sj.onc.1207416. Oncogene. 2004. PMID: 14755243 - The transcription factor Snail downregulates the tight junction components independently of E-cadherin downregulation.
Ohkubo T, Ozawa M. Ohkubo T, et al. J Cell Sci. 2004 Apr 1;117(Pt 9):1675-85. doi: 10.1242/jcs.01004. Epub 2004 Mar 9. J Cell Sci. 2004. PMID: 15075229 - Regulation of adherens junction protein p120(ctn) by 10 nM CCK precedes actin breakdown in rat pancreatic acini.
Leser J, Beil MF, Musa OA, Adler G, Lutz MP. Leser J, et al. Am J Physiol Gastrointest Liver Physiol. 2000 Mar;278(3):G486-91. doi: 10.1152/ajpgi.2000.278.3.G486. Am J Physiol Gastrointest Liver Physiol. 2000. PMID: 10712269 - Dancing in and out of the nucleus: p120(ctn) and the transcription factor Kaiso.
Daniel JM. Daniel JM. Biochim Biophys Acta. 2007 Jan;1773(1):59-68. doi: 10.1016/j.bbamcr.2006.08.052. Epub 2006 Sep 7. Biochim Biophys Acta. 2007. PMID: 17050009 Review. - Beta-catenin and Tcfs in mammary development and cancer.
Hatsell S, Rowlands T, Hiremath M, Cowin P. Hatsell S, et al. J Mammary Gland Biol Neoplasia. 2003 Apr;8(2):145-58. doi: 10.1023/a:1025944723047. J Mammary Gland Biol Neoplasia. 2003. PMID: 14635791 Review.
Cited by
- The Regulatory Role of MicroRNAs in EMT and Cancer.
Zaravinos A. Zaravinos A. J Oncol. 2015;2015:865816. doi: 10.1155/2015/865816. Epub 2015 Mar 25. J Oncol. 2015. PMID: 25883654 Free PMC article. Review. - Tumor: Stroma Interaction and Cancer.
Rogers MP, Mi Z, Li NY, Wai PY, Kuo PC. Rogers MP, et al. Exp Suppl. 2022;113:59-87. doi: 10.1007/978-3-030-91311-3_2. Exp Suppl. 2022. PMID: 35165860 - Decreased nuclear beta-catenin, tau hyperphosphorylation and neurodegeneration in GSK-3beta conditional transgenic mice.
Lucas JJ, Hernández F, Gómez-Ramos P, Morán MA, Hen R, Avila J. Lucas JJ, et al. EMBO J. 2001 Jan 15;20(1-2):27-39. doi: 10.1093/emboj/20.1.27. EMBO J. 2001. PMID: 11226152 Free PMC article. - Cancer Stem Cells, EMT, and Developmental Pathway Activation in Pancreatic Tumors.
Hindriksen S, Bijlsma MF. Hindriksen S, et al. Cancers (Basel). 2012 Oct 12;4(4):989-1035. doi: 10.3390/cancers4040989. Cancers (Basel). 2012. PMID: 24213498 Free PMC article. - KRAS and YAP1 converge to regulate EMT and tumor survival.
Shao DD, Xue W, Krall EB, Bhutkar A, Piccioni F, Wang X, Schinzel AC, Sood S, Rosenbluh J, Kim JW, Zwang Y, Roberts TM, Root DE, Jacks T, Hahn WC. Shao DD, et al. Cell. 2014 Jul 3;158(1):171-84. doi: 10.1016/j.cell.2014.06.004. Epub 2014 Jun 19. Cell. 2014. PMID: 24954536 Free PMC article.
References
- Aberle H., Schwartz H., Kemler R. Cadherin–catenin complexprotein interactions and their implications for cadherin function. J. Cell Biochem. 1996;61:514–523. - PubMed
- Barth A.I., Nathke I.S., Nelson W.J. Cadherins, catenins and APC proteininterplay between cytoskeletal complexes and signaling pathways. Curr. Opin. Cell Biol. 1997;9:683–690. - PubMed
- Behrens J., Jerchow B.A., Wurtele M., Grimm J., Asbrand C., Wirtz R., Kuhl M., Wedlich D., Birchmeier W. Functional interaction of an axin homolog, conductin, with beta-catenin, APC, and GSK3beta. Science. 1998;280:596–599. - PubMed
Publication types
MeSH terms
Substances
LinkOut - more resources
Full Text Sources
Other Literature Sources
Miscellaneous
