Dissociation from BiP and retrotranslocation of unassembled immunoglobulin light chains are tightly coupled to proteasome activity - PubMed (original) (raw)
Dissociation from BiP and retrotranslocation of unassembled immunoglobulin light chains are tightly coupled to proteasome activity
J Chillarón et al. Mol Biol Cell. 2000 Jan.
Free PMC article
Abstract
Unassembled immunoglobulin light chains expressed by the mouse plasmacytoma cell line NS1 (kappa(NS1)) are degraded in vivo with a half-life of 50-60 min in a way that closely resembles endoplasmic reticulum (ER)-associated degradation (). Here we show that the peptide aldehydes MG132 and PS1 and the specific proteasome inhibitor lactacystin effectively increased the half-life of kappa(NS1), arguing for a proteasome-mediated degradation pathway. Subcellular fractionation and protease protection assays have indicated an ER localization of kappa(NS1) upon proteasome inhibition. This was independently confirmed by the analysis of the folding state of kappa(NS1) and size fractionation experiments showing that the immunoglobulin light chain remained bound to the ER chaperone BiP when the activity of the proteasome was blocked. Moreover, kinetic studies performed in lactacystin-treated cells revealed a time-dependent increase in the physical stability of the BiP-kappa(NS1) complex, suggesting that additional proteins are present in the older complex. Together, our data support a model for ER-associated degradation in which both the release of a soluble nonglycosylated protein from BiP and its retrotranslocation out of the ER are tightly coupled with proteasome activity.
Figures
Figure 1
Effect of proteasome inhibitors on the half-life of Ig LκNS1 chains. A representative pulse–chase experiment is shown. NS1 cells were starved for 2 h in the presence of lactacystin or PS1, labeled for 30 min, and chased up to 4 h in the continuous presence of the inhibitors. MG132 was added after the pulse, because we observed a decrease in protein synthesis when it was present from the beginning of the experiment. At each of the time points indicated, postnuclear supernatant was prepared from equal numbers of cells (with the same incorporation of radiactivity) and used to immunoprecipitate the κNS1 chains as stated in MATERIALS AND METHODS. The calculated half-lifes in minutes are indicated.
Figure 2
Folding state of IgκNS1 chains upon lactacystin treatment. A pulse–chase experiment similar to that shown in Figure 1 was performed, with the following modifications: before lysis, cells were washed 5 min with PBS in the presence of 20 mM NEM, and the same NEM concentration was included during lysis. Ig L chains were immunoprecipitated under the usual conditions (see MATERIALS AND METHODS). SDS-PAGE was performed under nonreducing conditions, which allows distinction of two different folding forms of the κNS1 chains (I, partially oxidized; and II, completely oxidized).
Figure 3
Localization of Ig LκNS1 chains by cell fractionation. NS1 cells were starved, labeled, and chased for 3 h in the presence or absence or lactacystin (the amounts of κNS1 just after the pulse were the same in both conditions). Cells were mechanically homogenized, and the different fractions (P1, P2, P3, and SN) were obtained by differential centrifugation as indicated in MATERIALS AND METHODS. H corresponds to unfractionated material. Equivalent amounts of the fractions were used to immunoprecipitate BiP or κNS1 or to detect calreticulin by Western blotting. The signals from the immunoprecipitates were quantified by phosphorimager, and the Western blot signals were quantified by scanning densitometry using the NIH Image program. Note that the Ig L chains were stabilized by a factor of 6.4–8 (mean, 7.5) in three independent experiments, only one of which is shown.
Figure 4
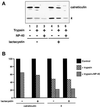
Trypsin resistance of κNS1 chains. (A) Equal amounts of the P3 fractions prepared from untreated and lactacystin-treated cells were treated with 15 μg/ml trypsin for 30 min at 30°C in the absence or presence of 0.5% NP-40. Digestions were stopped by the addition of 500 μg/ml trypsin inhibitor. Samples were used for either immunoprecipitation of Ig L chains or proving the amount of calreticulin by Western blot. (B) Ig L chain signals were quantified by phosphorimager, calreticulin signals were quantified by scanning densitometry, and the values were plotted as the percentage of the amount of the respective protein present in the corresponding untreated samples. Note that no calreticulin signals could be detected after trypsin digestion of NP-40-solubilized material.
Figure 5
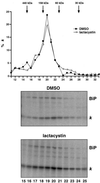
Size fractionation of κNS1 chains. NS1 cells were starved, labeled, and chased for 3 h in the presence or absence of lactacystin. For solubilization, cell concentrations were adjusted to 107cells/ml of NET buffer. Fifty microliters of sample were applied onto a Superdex 200 column (SMART system), and proteins were separated at a flow rate of 40 μl/min. Fractions of 50 μl were collected and used to immunoprecipitate the Ig L chains that were analyzed by SDS-PAGE under reducing conditions. (A) The signals were quantified by phosphorimager, and the amount of Ig L chains present in each fraction was plotted as the percentage of total Ig L chains present in the load. The molecular mass standarts used were ferritin (440 kDa), aldolase (158 kDa), BSA (60 kDa), and carbonic anhydrase (30 kDa). (B) The autoradiograms of the gels used to quantify the Ig L chain signals (fraction 15–25) are shown. Note that the signals for coprecipitated BiP parallels the Ig L chain distribution.
Figure 6
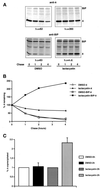
Effect of lactacystin on the dissociation of κNS1 from BiP. (A) The pulse–chase experiment was made under the same conditions as in Figure 1. Equal amounts of cells were used for immunoprecipitation of either Ig L chains or BiP. The calculated half-lives and dissociation rates in minutes are shown for comparison. Note that no dissociation rate can be calculated when lactacystin is added. A reprentative experiment is shown. (B) Ig L chain signals were quantified from the above-shown autoradiograms, and the signals at chase point 0 were set to 100. Note that the two curves obtained for κNS1 chains in the presence of lactacystin differ, depending on whether the Ig L chains were directly precipitated or coprecipitated with BiP. (C) The percentages of κNS1 chains coprecipitated with BiP were calculated at 0 and 2 h of chase. These data represent the mean from seven independent experiments. At each time, the value obtained at 0 h in the control situation (DMSO-0 h) was set to 1.
Similar articles
- Proteasome inhibition leads to a heat-shock response, induction of endoplasmic reticulum chaperones, and thermotolerance.
Bush KT, Goldberg AL, Nigam SK. Bush KT, et al. J Biol Chem. 1997 Apr 4;272(14):9086-92. doi: 10.1074/jbc.272.14.9086. J Biol Chem. 1997. PMID: 9083035 - Proparathyroid hormone-related protein is associated with the chaperone protein BiP and undergoes proteasome-mediated degradation.
Meerovitch K, Wing S, Goltzman D. Meerovitch K, et al. J Biol Chem. 1998 Aug 14;273(33):21025-30. doi: 10.1074/jbc.273.33.21025. J Biol Chem. 1998. PMID: 9694854 - Degradation of unassembled soluble Ig subunits by cytosolic proteasomes: evidence that retrotranslocation and degradation are coupled events.
Mancini R, Fagioli C, Fra AM, Maggioni C, Sitia R. Mancini R, et al. FASEB J. 2000 Apr;14(5):769-78. doi: 10.1096/fasebj.14.5.769. FASEB J. 2000. PMID: 10744633 - Lactacystin, proteasome function, and cell fate.
Fenteany G, Schreiber SL. Fenteany G, et al. J Biol Chem. 1998 Apr 10;273(15):8545-8. doi: 10.1074/jbc.273.15.8545. J Biol Chem. 1998. PMID: 9535824 Review. No abstract available. - ER protein quality control and proteasome-mediated protein degradation.
Brodsky JL, McCracken AA. Brodsky JL, et al. Semin Cell Dev Biol. 1999 Oct;10(5):507-13. doi: 10.1006/scdb.1999.0321. Semin Cell Dev Biol. 1999. PMID: 10597633 Review.
Cited by
- Identification of two rate-limiting steps in the degradation of partially folded immunoglobulin light chains.
Mann MJ, Flory AR, Oikonomou C, Hayes CA, Melendez-Suchi C, Hendershot LM. Mann MJ, et al. Front Cell Dev Biol. 2022 Aug 22;10:924848. doi: 10.3389/fcell.2022.924848. eCollection 2022. Front Cell Dev Biol. 2022. PMID: 36072336 Free PMC article. - Metabolic and Transcriptional Modules Independently Diversify Plasma Cell Lifespan and Function.
Lam WY, Jash A, Yao CH, D'Souza L, Wong R, Nunley RM, Meares GP, Patti GJ, Bhattacharya D. Lam WY, et al. Cell Rep. 2018 Aug 28;24(9):2479-2492.e6. doi: 10.1016/j.celrep.2018.07.084. Cell Rep. 2018. PMID: 30157439 Free PMC article. - OS-9 facilitates turnover of nonnative GRP94 marked by hyperglycosylation.
Dersh D, Jones SM, Eletto D, Christianson JC, Argon Y. Dersh D, et al. Mol Biol Cell. 2014 Aug 1;25(15):2220-34. doi: 10.1091/mbc.E14-03-0805. Epub 2014 Jun 4. Mol Biol Cell. 2014. PMID: 24899641 Free PMC article. - Aggresomes and Russell bodies. Symptoms of cellular indigestion?
Kopito RR, Sitia R. Kopito RR, et al. EMBO Rep. 2000 Sep;1(3):225-31. doi: 10.1093/embo-reports/kvd052. EMBO Rep. 2000. PMID: 11256604 Free PMC article. Review. - Dependence of endoplasmic reticulum-associated degradation on the peptide binding domain and concentration of BiP.
Kabani M, Kelley SS, Morrow MW, Montgomery DL, Sivendran R, Rose MD, Gierasch LM, Brodsky JL. Kabani M, et al. Mol Biol Cell. 2003 Aug;14(8):3437-48. doi: 10.1091/mbc.e02-12-0847. Epub 2003 Apr 17. Mol Biol Cell. 2003. PMID: 12925775 Free PMC article.
References
- Beggah A, Mathews P, Beguin P, Geering K. Degradation and endoplasmic reticulum retention of unassembled alpha and beta subunits of Na, K ATPase correlate with interaction of BiP. J Biol Chem. 1996;271:20895–20902. - PubMed
- Biederer T, Volkwein C, Sommer T. Role of Cue1p in ubiquitination and degradation at the ER surface. Science. 1997;278:1806–1809. - PubMed
- Brodsky JL, McCracken AA. ER associated and proteasome mediated protein degradation: How two topologically restricted events came together. Trends Cell Biol. 1997;7:151–156. - PubMed
- Brodsky JL, Werner ED, Dubas ME, Goeckeler JL, Kruse KB, McCracken AA. The requirement for molecular chaperones during endoplasmic reticulum-associated protein degradation demonstrates that protein export and import are mechanistically distinct. J Biol Chem. 1999;274:3453–3460. - PubMed
Publication types
MeSH terms
Substances
LinkOut - more resources
Full Text Sources
Miscellaneous


