Proapoptotic BH3-only Bcl-2 family members induce cytochrome c release, but not mitochondrial membrane potential loss, and do not directly modulate voltage-dependent anion channel activity - PubMed (original) (raw)
Proapoptotic BH3-only Bcl-2 family members induce cytochrome c release, but not mitochondrial membrane potential loss, and do not directly modulate voltage-dependent anion channel activity
S Shimizu et al. Proc Natl Acad Sci U S A. 2000.
Abstract
Through direct interaction with the voltage-dependent anion channel (VDAC), proapoptotic Bcl-2 family members such as Bax and Bak induce apoptogenic mitochondrial cytochrome c release and membrane potential (Deltapsi) loss in isolated mitochondria. Using isolated mitochondria, we showed that Bid and Bik, BH3-only proteins from the Bcl-2 family, induced cytochrome c release but not Deltapsi loss. Unlike Bax/Bak, the cytochrome c release induced by Bid/Bik was Ca(2+)-independent, cyclosporin A-insensitive, and respiration-independent. Furthermore, in contrast to Bax/Bak, Bid/Bik neither interacted with VDAC nor directly affected the VDAC activity in liposomes. Consistently, Bid/Bik induced apoptosis without Deltapsi loss, whereas Bax induced apoptosis with Deltapsi loss. These findings indicated the involvement of a different mechanism in BH3-only, protein-induced apoptogenic cytochrome c release.
Figures
Figure 1
Induction of cytochrome c release by BH3-only proteins without affecting Δψ. (a and b) Induction of cytochrome c release by BH3-only proteins in isolated mitochondria. Mitochondria (1 mg/ml) were incubated with rBid, rBax, rtBid, or rBik at the indicated concentrations. At the indicated times (a) and at 10 min (b), samples were centrifuged and aliquots (20 μl) of the supernatants were subjected to Western blot analysis for cytochrome c (cyt c). “total” represents an equivalent aliquot of mitochondria. (c and d) No effect of BH3-only proteins on Δψ in isolated mitochondria. Mitochondria (1 mg/ml) were incubated with 50 μg/ml (c) or the indicated concentration (d) of rBax (open bar in d), rBid (shaded bar in d), rtBid (hatched bar in d), rBik (solid bar in d), or mock protein, and Δψ was measured by using rhodamine uptake over 15 min (c) or at 15 min (d).
Figure 2
BH3-only proteins induce cytochrome c release without the PT. (a and b) Prevention of rBax-induced, but not Bid- and Bik-induced, cytochrome c release by Ca2+ chelation, CsA, and BK. Mitochondria (1 mg/ml) were incubated for 10 min with rBax (at the indicated concentrations in a and at 20 μg/ml in b) or with rBid (20 μg/ml) and rBik (20 μg/ml) in the presence or absence of 0.2 mM EGTA (a), 1 μM CsA (b), and 1 μM BK (b). Samples were centrifuged and aliquots (20 μl) of the supernatants were subjected to Western blot analysis for cytochrome c (cyt c). “total” represents an equivalent aliquot of mitochondria.
Figure 3
Prevention of Bax- and Ca2+-induced, but not Bid-induced, cytochrome c release by inhibition of respiration. Mitochondria (1 mg/ml) were incubated with rBax (20 μg/ml), Ca2+ (50 μM), or rBid (20 μg/ml) in the presence or absence of 5 mM succinate (a) or were incubated with or without 10 μM oligomycin, 10 μM antimycin A (antA), 1 mM KCN, or 1 mM CCCP (b). At the indicated times (a) and at 10 min (b), samples were centrifuged and aliquots (20 μl) of the supernatants were analyzed by Western blotting by using anticytochrome c antibody.
Figure 4
Role of the BH3 domain in Bid-induced cytochrome c release. (a and b) Induction of Δψ loss and cytochrome c release by BH3 peptides. Mitochondria (1 mg/ml) were incubated in the presence of the following peptides (10 μM), and Δψ (a) and cytochrome c release (b) were measured at 10 min: Bax (amino acid residues 55–74), Bak (amino acid residues 73–87), Bid (amino acid residues 82–101), Bik (amino acid residues 53–72), BaxΔGD (Bax peptide lacking G67D68), and BakΔGD (Bak peptide lacking G82D83). Peptides derived from hexokinase (HK; amino acid residues 2–21) and Bcl-2 BH4 (amino acid residues 10–30) also were added as controls. Complete loss of Δψ was demonstrated by incubation of mitochondria with 1 mM CCCP for 10 min. (c) Prevention of BH3 peptide-induced cytochrome c release by CsA, Ca2+ chelation, and antimycin A. Mitochondria (1 mg/ml) were incubated for 10 min with Bid BH3 peptide (10 μM) in the presence of 1 μM CsA, 0.2 mM EGTA, and 10 μM antimycin A (antA). (d) Requirement of the BH3 domain for Bid-induced cytochrome c release. Mitochondria (1 mg/ml) were incubated with rBid and mutant Bid GD/EE (G94D95 to E94E95) at the indicated concentrations for 10 min, and cytochrome c release was measured as described in Materials and Methods. “total” in b–d represents an equivalent aliquot of mitochondria.
Figure 5
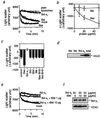
No direct effect of Bid on VDAC activity. (a and b) Inability of Bid to directly modulate VDAC activity. Plain liposomes and VDAC liposomes were incubated with 50 mM sucrose together with rBcl-xL, rBax, or rBid at 20 μg/ml (a) or at indicated concentrations (b) and with an equivalent amount of mock protein. In a, liposome swelling was assessed continuously for 10 min by the decrease of light scatter by using a spectrophotometer at a wavelength of 520 nm. In b, the changes of light scatter at 10 min from the initial value (time 0) are shown. (c) Inability of BH3-only proteins and BH3 peptides to modulate VDAC activity. VDAC liposomes were incubated with 50 mM sucrose with or without rBax, rBcl-xL, rBid, rtBid, or rBik at 50 μg/ml or with or without Bax BH3 peptide and Bid BH3 peptide at 10 μM, and the differences of light scatter at 10 min from the initial value (time 0) are shown. (d) No direct interaction of Bid and Bik with VDAC. Purified rat liver VDAC (0.2 μg) was incubated with GST-Bid, GST-Bik, or GST-Bcl-xL fusion protein (0.2 μg each), followed by incubation with GSH-Sepharose as described in Materials and Methods. After washing three times, the bound VDAC was analyzed by Western blotting. “total” represents the amount of VDAC used for the experiment. (e) Effect of tBid on Bcl-xL activity to inhibit VDAC activity. VDAC liposomes were incubated with 50 mM sucrose together with mock protein or Bcl-xL (20 μg/ml) in the presence or absence of tBid at the indicated concentrations, and the changes of light scatter were monitored continuously. (f) Effect of tBid on interaction between Bcl-xL and VDAC in VDAC liposomes. VDAC liposomes (20 μl) were incubated with Bcl-xL (20 μg/ml) in the presence of tBid at the indicated concentrations. These samples were subjected to immunoprecipitation with an anti-VDAC antibody, and the immune complexes were analyzed by Western blotting by using anti-VDAC and anti-Bcl-xL antibodies as described in Materials and Methods.
Figure 6
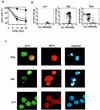
Decrease of mitochondrial Δψ by transfection of bax but not bid. (a) Effect of transient expression of Bax and Bid on mitochondrial Δψ and apoptosis. 293T cells were transfected with an expression construct (0.3 μg) for Bax (open symbols) and Bid (solid symbols), together with 0.1 μg of the GFP expression construct (for detection of DNA-transfected cells). At the indicated times, transfected cells were stained with MTR for measuring Δψ and with biotin-conjugated annexin V and streptavidin-red 617 for detecting apoptosis. Then, apoptosis (circles) and Δψ (squares) were measured by using a flow cytometer. The fractions of apoptotic cells and low Δψ cells were determined as the percentage of annexin V-positive, GFP-positive cells and MTR-negative, GFP-positive cells, respectively, among all GFP-positive cells. Data are shown as the mean ± SD for three independent experiments. (b) Representative flow cytometric profile of Bid- and Bax-overexpressing cells. The same experiments as in a were performed. Empty vector (0.3 μg) together with 0.1 μg of the GFP expression construct also was transfected as a control. After 24 hr, GFP-positive cells were gated and apoptosis (annexin V) and Δψ were analyzed by using a flow cytometer. (c) Representative morphology of _bax_- and _bid_-transfected cells. 293T cells were transfected with an expression construct (0.3 μg) for Bax, Bid, or empty vector, together with 0.1 μg of the GFP expression construct. After 24 hr, cells were stained with MTR to monitor Δψ and with Hoechst 33342 to assess nuclear morphology and were observed by using a fluorescent microscope. GFP-positive cells were stained green, and cells maintaining their Δψ were strongly stained orange (MTR).
Similar articles
- Essential role of voltage-dependent anion channel in various forms of apoptosis in mammalian cells.
Shimizu S, Matsuoka Y, Shinohara Y, Yoneda Y, Tsujimoto Y. Shimizu S, et al. J Cell Biol. 2001 Jan 22;152(2):237-50. doi: 10.1083/jcb.152.2.237. J Cell Biol. 2001. PMID: 11266442 Free PMC article. - Bcl-2 family proteins regulate the release of apoptogenic cytochrome c by the mitochondrial channel VDAC.
Shimizu S, Narita M, Tsujimoto Y. Shimizu S, et al. Nature. 1999 Jun 3;399(6735):483-7. doi: 10.1038/20959. Nature. 1999. PMID: 10365962 - Control of mitochondrial permeability by Bcl-2 family members.
Sharpe JC, Arnoult D, Youle RJ. Sharpe JC, et al. Biochim Biophys Acta. 2004 Mar 1;1644(2-3):107-13. doi: 10.1016/j.bbamcr.2003.10.016. Biochim Biophys Acta. 2004. PMID: 14996495 Review. - The voltage-dependent anion channel: an essential player in apoptosis.
Tsujimoto Y, Shimizu S. Tsujimoto Y, et al. Biochimie. 2002 Feb-Mar;84(2-3):187-93. doi: 10.1016/s0300-9084(02)01370-6. Biochimie. 2002. PMID: 12022949 Review.
Cited by
- 4-Carbomethoxyl-10-Epigyrosanoldie E Extracted from Cultured Soft Coral Sinularia sandensis Induced Apoptosis and Autophagy via ROS and Mitochondrial Dysfunction and ER Stress in Oral Cancer Cells.
She YY, Lin JJ, Su JH, Chang TS, Wu YJ. She YY, et al. Oxid Med Cell Longev. 2022 Oct 13;2022:3017807. doi: 10.1155/2022/3017807. eCollection 2022. Oxid Med Cell Longev. 2022. PMID: 36275891 Free PMC article. - BIK/NBK gene as potential marker of prognostic and therapeutic target in breast cancer patients.
López-Muñoz E, Hernández-Zarco A, García-Hernández N, Alvarado-Cabrero I, Zarco-Espinosa G, Salamanca-Gómez F, Arenas-Aranda D. López-Muñoz E, et al. Clin Transl Oncol. 2012 Aug;14(8):586-91. doi: 10.1007/s12094-012-0845-8. Epub 2012 Jul 11. Clin Transl Oncol. 2012. PMID: 22855140 - The role of apoptosis in the pathogenesis of the myelodysplastic syndromes.
Parker JE, Mufti GJ. Parker JE, et al. Int J Hematol. 2001 Jun;73(4):416-428. doi: 10.1007/BF02994003. Int J Hematol. 2001. PMID: 11503955 Review. - Apo2L/TRAIL and Bcl-2-related proteins regulate type I interferon-induced apoptosis in multiple myeloma.
Chen Q, Gong B, Mahmoud-Ahmed AS, Zhou A, Hsi ED, Hussein M, Almasan A. Chen Q, et al. Blood. 2001 Oct 1;98(7):2183-92. doi: 10.1182/blood.v98.7.2183. Blood. 2001. PMID: 11568006 Free PMC article. - Apoptosis and inhibition of proliferation of cancer cells induced by cordycepin.
Tian X, Li Y, Shen Y, Li Q, Wang Q, Feng L. Tian X, et al. Oncol Lett. 2015 Aug;10(2):595-599. doi: 10.3892/ol.2015.3273. Epub 2015 May 27. Oncol Lett. 2015. PMID: 26622539 Free PMC article.
References
- Adams J M, Cory S. Science. 1998;281:1322–1326. - PubMed
- Tsujimoto Y. Genes Cells. 1998;3:697–707. - PubMed
- Green D R, Reed J C. Science. 1998;281:1309–1312. - PubMed
- Liu X, Kim C N, Yang J, Jemmerson R, Wang X. Cell. 1996;86:147–157. - PubMed
- Yang J, Liu X, Bhalla K, Kim C N, Ibrado A M, Cai J, Peng T I, Jones D P, Wang X. Science. 1997;275:1129–1132. - PubMed
Publication types
MeSH terms
Substances
LinkOut - more resources
Full Text Sources
Other Literature Sources
Research Materials
Miscellaneous


