Fast network oscillations in the newborn rat hippocampus in vitro - PubMed (original) (raw)
Fast network oscillations in the newborn rat hippocampus in vitro
J M Palva et al. J Neurosci. 2000.
Abstract
Spontaneous neural activity is crucial for the formation of the intricate patterns of cortical connectivity during development. In particular, temporal correlations in presynaptic and postsynaptic activity have been hypothesized to be a critical determinant in the selection of neurons that are to become wired together. To date, however, temporally correlated activity in the neonatal brain has been believed to take place with a precision of tens of milliseconds to seconds. Here we describe a novel type of a fast network oscillation associated with millisecond synchronization of pyramidal cell firing in newborn rat hippocampus in vitro. Individual pyramidal neurons fired mainly at lower gamma frequencies (20-40 Hz) but were synchronized into a high-frequency (100-400 Hz) population oscillation that was reflected in field potential spikes and intracellular AMPA-kainate receptor-mediated currents. The high-frequency population oscillation was patterned by a gamma-frequency modulatory oscillation. The gamma modulation was imposed by GABAergic currents, which exerted an inhibitory action on pyramidal neurons. Patterned activity based on GABAergic inhibition and glutamatergic excitation thus occurs already in newborn hippocampus. The network oscillations described here may be a mechanism for selective coincidence detection with a millisecond range temporal precision to shape the patterns of connectivity within the emerging hippocampal synaptic circuitry.
Figures
Fig. 1.
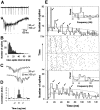
Millisecond range synchronization and gamma-frequency modulation of the field potential spikes.A, Population activity is seen in filtered (20 Hz low-pass) field potential recordings as a continuous stream of negative deflections (top trace). Each negative deflection is associated with a burst of field potential spikes (bottom trace) (low-pass filtered at 700 Hz). The field potential spikes are marked with dots below the trace.B, The distribution of interspike intervals in this experiment (675 spikes in 77 bursts) C, A burst of population spikes recorded simultaneously with two extracellular electrodes separated by 100 μm. D, An averaged cross-correlogram of 149 pairs of population bursts in three recordings showing that the synchronized field potential spikes coincide with a jitter of < 1 msec. The correlation is before averaging expressed as the number of baseline SDs between the correlogram and baseline mean. E, Middle panel, The occurrence of field potential spikes (marked with dots) after the first spike of the burst is rhythmically patterned. One_horizontal strip_ of dots represents the spikes of one burst. All 77 bursts in this experiment are shown starting from the bottom. Note how the vertical columns of spikes are systematically tilted to the left, demonstrating the time-varying nature of the modulation. Top and_bottom panels,_ Histograms of spike occurrence modulation. The first half of the experiment is pooled to the lower histogram, and the second half to the upper. The dotted lines represent the 95% confidence limits (mean + 2 SDs of shuffled histograms). Gray lines indicate the mean of the shuffled histograms (see Materials and Methods). The_arrows_ show the four significant peaks in both histograms. Insets, Power spectra of the corresponding spike occurrence histograms showing highly significant gamma-frequency oscillations. The dotted lines denote the 99% confidence limits (mean + 3 SDs of power spectra computed for shuffled histograms). The mean of shuffled data are shown by the gray lines.
Fig. 2.
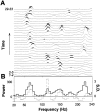
Transient gamma- and high-frequency oscillations in field potential spike bursts. A, Power spectra of all 29 cumulative ACHs in this experiment. Four consecutive spike bursts were taken into each ACH, and this window of four was shifted one at a time. Black parts of the power spectra are above the 99% confidence limit. B, Averaging the power spectra of 29 ACHs (33 spike bursts) abolishes significant oscillations.Black line, Mean of the power spectra in_A;_ dotted line, mean of the normalized power spectra. The spectra were normalized by subtracting the mean of shuffled data and dividing with the SD. Significant oscillations in most of the power spectra thus fall below the significance level when averaged.
Fig. 3.
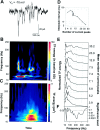
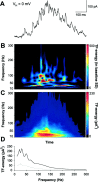
During spontaneous network events, AMPA–kainate receptor-mediated currents show oscillations at gamma- and high-frequencies. A, A spontaneous event in a P5 pyramidal neuron clamped at −70 mV showing the AMPA–kainate receptor-mediated glutamatergic currents. B, A TF representation of the glutamatergic currents in A. Time runs along the _x_-axis and frequency along the_y_-axis. The time scale is the same as in the current trace above the TF representation. The amplitude is coded in color so that red color corresponds to higher amplitude (see Materials and Methods for details). The high-frequency components are related to the current clusters occurring at gamma frequencies.C, An averaged TF representation of 103 consecutive spontaneous bursts of AMPA–kainate currents displaying the major peak in the lower (20–40 Hz) and a subsidiary peak in the upper (50–80 Hz) gamma-frequency band. D, The mean interpeak interval was dependent on the mean number of AMPA–kainate current peaks in bursts (p < 0.005; one-way ANOVA).E, Frequency distributions of the AMPA–kainate receptor-mediated current bursts in nine neurons. The distributions were obtained by averaging the TF representations of all current bursts (33–103 averages) in a single recording and then averaging 25–100 msec around the major peak. The distributions are normalized to have unit area. The mean number of current peaks during a population burst is given right to the distributions. F, Significance level as a function of frequency (one-way ANOVA). A below average amount of AMPA–kainate inputs per burst was associated with pronounced gamma-frequency oscillations, whereas large numbers of AMPA–kainate inputs/burst were found in neurons showing prominent high-frequency oscillations.
Fig. 4.
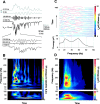
High-frequency AMPA–kainate currents are amplitude modulated at gamma frequencies. A,Two top traces(gray), amplitude envelope of the 100–450 Hz frequency band (filtered as indicated in the figure). Two middle traces, The band-pass filtered and the original high-frequency burst of AMPA–kainate currents. Note how the high-frequency oscillation is amplitude modulated at ∼30 Hz. Three lowest traces, The first 100 msec of the AMPA–kainate current burst is expanded to show the high-frequency oscillations around 180 and 330 Hz (see B). B, _Top panel,A TF representation of the original current trace in A. The time scale is the same as in the four top current_traces. Bottom panel, A TF representation of the amplitude envelope (highest current trace). C,Top panel, Frequency distributions of the amplitude modulation for all 44 bursts in this experiment. The amplitude modulation was computed for high-frequency oscillations around 210 Hz (160–260 Hz, see D). The distributions were obtained by averaging the first 75 msec of each TF representation of amplitude envelopes. Bottom panel, Averaged frequency distribution showing peaks around 20 and 60 Hz. D, Top panel, An averaged TF representation of the 44 bursts in this experiment. The time scale is the same as in B. Note the pronounced peaks around 120 and 210 Hz. Bottom panel, An averaged TF representation of the amplitude modulation.
Fig. 5.
Interneuronal networks produce gamma- and high-frequency oscillations in immature hippocampus. A, A spontaneous event in a P5 pyramidal neuron (the same as in Fig. 3) whole-cell voltage-clamped near the AMPA–kainate reversal potential (0 mV) demonstrating the GABAergic currents. B, A TF representation of the GABA currents in A. Note the series of brief high-frequency (here 100–200 Hz) components over the prominent oscillation in the gamma-frequency band. C, An averaged TF representation of 101 bursts of GABAergic currents showing a major peak in the 20–40 Hz range. Note the similarity between the frequency contents of GABA and AMPA–kainate (Fig. 3) currents in the lower gamma-band of the averaged TF representations. D, Frequency distribution of the GABA currents computed from_C_ to allow for a comparison with Figure 3. Gray line indicates 3 SDs of preburst noise.
Fig. 6.
Field potential spikes are often found on ascending and descending slopes of GABAergic currents and only rarely on the current peaks. A, A barrage of GABAergic currents is seen in pyramidal neurons during the population events. The intracellular recording (bottom trace) is simultaneous with the field potential recording (top trace). The neuron was recorded at a distance of 100 μm from the extracellular electrode and whole-cell voltage-clamped to ∼0 mV. B, Correlation of the field potential spikes and GABAergic currents.Top panel, Distribution of field potential spikes around the spike occurring at t = 0. The values are pooled from six experiments and 805 spikes in 156 spontaneous events.Bottom panel, Mean GABAergic current around a field potential spike occurring at t = 0, dotted lines indicate the SEM (see Materials and Methods for details). As the GABAergic currents are positive (outward), negative mean values indicate that field potential spikes are inversely correlated with the GABAergic currents.
Fig. 7.
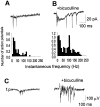
GABAA receptor-mediated transmission restrains the activity of both the individual pyramidal cells and the pyramidal cell population. A, A typical firing pattern of a pyramidal neuron recorded in a cell-attached configuration. The sharp downward deflections are action potentials. B, Cell-attached recording of a spontaneous burst during a bath application of bicuculline methiodide (10 μ
m
).A, B, _Bottom panels,_Respective histograms of the action potential instantaneous frequencies in control (pooled from five cells and 25 spike bursts) and in bicuculline (pooled from four cells and 20 spontaneous events). The histograms are normalized with the number of events; the_y_-axis thus depicts the mean number of spikes (occurring during a single spontaneous event) in corresponding 10 Hz frequency bins along the _x_-axis. C, A field potential recording showing a population burst under control conditions and in the presence of bicuculline.
Similar articles
- Synaptic GABA(A) activation inhibits AMPA-kainate receptor-mediated bursting in the newborn (P0-P2) rat hippocampus.
Lamsa K, Palva JM, Ruusuvuori E, Kaila K, Taira T. Lamsa K, et al. J Neurophysiol. 2000 Jan;83(1):359-66. doi: 10.1152/jn.2000.83.1.359. J Neurophysiol. 2000. PMID: 10634879 - Synchronization of GABAergic interneuronal network in CA3 subfield of neonatal rat hippocampal slices.
Khazipov R, Leinekugel X, Khalilov I, Gaiarsa JL, Ben-Ari Y. Khazipov R, et al. J Physiol. 1997 Feb 1;498 ( Pt 3)(Pt 3):763-72. doi: 10.1113/jphysiol.1997.sp021900. J Physiol. 1997. PMID: 9051587 Free PMC article. - Profound regulation of neonatal CA1 rat hippocampal GABAergic transmission by functionally distinct kainate receptor populations.
Maingret F, Lauri SE, Taira T, Isaac JT. Maingret F, et al. J Physiol. 2005 Aug 15;567(Pt 1):131-42. doi: 10.1113/jphysiol.2005.089474. Epub 2005 Jun 9. J Physiol. 2005. PMID: 15946969 Free PMC article. - [Neural mechanism underlying generation of synchronous oscillations in hippocampal network].
Fujiwara-Tsukamoto Y, Isomura Y. Fujiwara-Tsukamoto Y, et al. Brain Nerve. 2008 Jul;60(7):755-62. Brain Nerve. 2008. PMID: 18646615 Review. Japanese. - Cellular mechanisms of neuronal population oscillations in the hippocampus in vitro.
Traub RD, Bibbig A, LeBeau FE, Buhl EH, Whittington MA. Traub RD, et al. Annu Rev Neurosci. 2004;27:247-78. doi: 10.1146/annurev.neuro.27.070203.144303. Annu Rev Neurosci. 2004. PMID: 15217333 Review.
Cited by
- GluA4 subunit of AMPA receptors mediates the early synaptic response to altered network activity in the developing hippocampus.
Huupponen J, Atanasova T, Taira T, Lauri SE. Huupponen J, et al. J Neurophysiol. 2016 Jun 1;115(6):2989-96. doi: 10.1152/jn.00435.2015. Epub 2016 Mar 9. J Neurophysiol. 2016. PMID: 26961102 Free PMC article. - Hippocampal sharp wave-ripple: A cognitive biomarker for episodic memory and planning.
Buzsáki G. Buzsáki G. Hippocampus. 2015 Oct;25(10):1073-188. doi: 10.1002/hipo.22488. Hippocampus. 2015. PMID: 26135716 Free PMC article. Review. - High firing rate of neonatal hippocampal interneurons is caused by attenuation of afterhyperpolarizing potassium currents by tonically active kainate receptors.
Segerstråle M, Juuri J, Lanore F, Piepponen P, Lauri SE, Mulle C, Taira T. Segerstråle M, et al. J Neurosci. 2010 May 12;30(19):6507-14. doi: 10.1523/JNEUROSCI.4856-09.2010. J Neurosci. 2010. PMID: 20463214 Free PMC article. - Brain-derived neurotrophic factor controls activity-dependent maturation of CA1 synapses by downregulating tonic activation of presynaptic kainate receptors.
Sallert M, Rantamäki T, Vesikansa A, Anthoni H, Harju K, Yli-Kauhaluoma J, Taira T, Castren E, Lauri SE. Sallert M, et al. J Neurosci. 2009 Sep 9;29(36):11294-303. doi: 10.1523/JNEUROSCI.0560-09.2009. J Neurosci. 2009. PMID: 19741136 Free PMC article. - Amygdalocortical circuitry in schizophrenia: from circuits to molecules.
Benes FM. Benes FM. Neuropsychopharmacology. 2010 Jan;35(1):239-57. doi: 10.1038/npp.2009.116. Neuropsychopharmacology. 2010. PMID: 19727065 Free PMC article. Review.
References
- Bell CC, Han VZ, Suguwara Y, Grant K. Synaptic plasticity in a cerebellum-like structure depends on temporal order. Nature. 1997;387:278–281. - PubMed
- Ben-Ari Y, Khazipov R, Leinekugel X, Caillard O, Gaiarsa J-L. GABAA, NMDA and AMPA receptors: a developmentally regulated “ménage à trois”. Trends Neurosci. 1997;20:523–529. - PubMed
Publication types
MeSH terms
Substances
LinkOut - more resources
Full Text Sources
