Discharge properties of juxtacellularly labeled and immunohistochemically identified cholinergic basal forebrain neurons recorded in association with the electroencephalogram in anesthetized rats - PubMed (original) (raw)
Discharge properties of juxtacellularly labeled and immunohistochemically identified cholinergic basal forebrain neurons recorded in association with the electroencephalogram in anesthetized rats
I D Manns et al. J Neurosci. 2000.
Abstract
Multiple lines of evidence indicate that cholinergic basal forebrain neurons play an important role in the regulation of cortical activity and state. However, the discharge properties of cholinergic cells in relation to the electroencephalogram (EEG) are not yet known. In the present study, cells were recorded in the basal forebrain in association with cortical EEG activity in urethane-anesthetized rats, and their discharge was examined during EEG irregular slow activity and during stimulation-induced cortical activation, characterized by rhythmic slow (theta) and high-frequency (gamma) activities. Recorded cells were labeled with Neurobiotin (Nb), using the juxtacellular technique and identified as cholinergic by immunohistochemical staining for choline acetyltransferase (ChAT). Nb-positive/ChAT-positive neurons were distinctive and significantly different from Nb-positive/ChAT-negative neurons, which were heterogeneous in their discharge properties. All Nb(+)/ChAT(+) cells increased their discharge rate with stimulation, and most shifted from an irregular tonic discharge during EEG slow irregular activity to a rhythmic burst discharge during rhythmic slow activity. The stimulation-induced rhythmic discharge was cross-correlated with the EEG rhythmic slow activity. In some units the rhythmic discharge matched the rhythmic slow activity of the retrosplenial cortex; in others, it matched that of the prefrontal cortex, which occurred at a slower frequency, suggesting that subsets of cholinergic neurons may influence their cortical target areas rhythmically at particular frequencies. Cholinergic basal forebrain neurons thus may evoke and enhance cortical activation via both an increase in rate and a change in pattern to rhythmic bursting that would stimulate rhythmic slow (theta-like) activity in cortical fields during active waking and paradoxical sleep states.
Figures
Fig. 1.
Medium-sized multipolar neuron recorded and labeled by the juxtacellular technique with Neurobiotin (Nb; revealed with nickel-enhanced DAB) in the MCPO region of the basal forebrain. Scale bar, 50 μm.
Fig. 2.
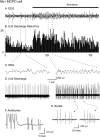
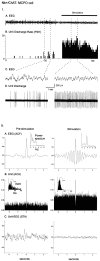
Discharge pattern of Nb-labeled neuron in the MCPO before and during stimulation of the animal. A, EEG (from retrosplenial cortex) and (B) peristimulus histogram (PSH) of the mean rate of discharge (in spikes per sec) during prestimulation and stimulation conditions.C, EEG and (D) unit discharge traces are expanded from the two conditions (left and_right_). Note the increase in rate of discharge and change in pattern of discharge from tonic to bursting with stimulation of the unit in association with a change in the pattern of EEG activity. E, Expanded traces of individual bursts showing variable firing frequencies. F, Antidromic activation of bursting MCPO neuron from prefrontal cortex.
Fig. 3.
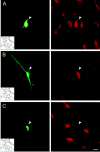
Photomicrographs of recorded and juxtacellularly labeled Nb+/ChAT+ and Nb+/ChAT− neurons located in the basal forebrain cholinergic cell area. Nb was revealed with green fluorescent Cy2-conjugated streptavidin (left) and ChAT immunostaining with red fluorescent Cy3-conjugated secondary antibodies (right). A, Nb+/ChAT+ neuron (#98o18003/6) in MCPO lying among other ChAT+ cells.B, Nb+/ChAT+neuron (# 98812009/10) in SI. C, Nb+/ChAT− neuron (#98629000) in MCPO surrounded by ChAT+ neurons. Scale bar, 20 μm.
Fig. 4.
Distribution of recorded and characterized Nb+/ChAT+ (filled circles) and Nb+/ChAT−(open circles) neurons in the basal forebrain [represented on atlas sections adapted from Gritti et al. (1993)]. Scale bar, 1 mm. Acb, Accumbens nucleus;ac, anterior commissure; BST, bed of the stria terminalis; CPu, caudate putamen;DBB, diagonal band of Broca nucleus; f, fornix; FStr, fundus of striatum; GP, globus pallidus; LPOA, lateral preoptic area;LS, lateral septum; MCPO, magnocellular preoptic nucleus; MS, medial septum; oc, optic chiasm; OTu, olfactory tubercle;Pir, piriform cortex; Ret, reticularis nucleus; SIa, substantia innominata pars anterior;SIp, substantia innominata pars posterior;sm, stria medullaris.
Fig. 5.
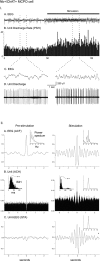
I. Discharge pattern of Nb+/ChAT+ neuron (#98o18003/6) in the MCPO (see Fig. 3_A_). A, EEG (from retrosplenial cortex) and (B) peristimulus histogram (PSH) of the mean rate of discharge (in spikes per sec) before and during stimulation of the animal.C, EEG and (D) unit discharge traces are expanded for both prestimulation and stimulation conditions (left and right). Note the change from a tonic discharge pattern to a burst-like discharge pattern in addition to the increased rate of discharge with stimulation and in association with a change in EEG activity. II. EEG and unit analysis during prestimulation and stimulation conditions. A, Autocorrelation functions (ACF; with correlation coefficients on vertical axes) of the prestimulation and stimulation EEG recordings and corresponding power spectra. B, Autocorrelation histograms (ACH; with correlation coefficients on vertical axes) of prestimulation and stimulation period unit spike trains and insets of corresponding interspike interval histograms (ISIH). A power spectrum is shown (inset) for the stimulation ACH in which rhythmic activity is apparent. C, Spike-triggered averages (STA) of unit–EEG cross-correlation (with mV on vertical axes) for actual unit (black line) and randomized spike train (gray line). A power spectrum is shown (inset) for the stimulation STA in which the actual unit–EEG function was significantly different from the randomized spike train unit–EEG function (Wilcoxon test; *p < 0.05). Note with stimulation the appearance of cross-correlated EEG and unit rhythmic activity with a peak frequency of ∼ 3.8 Hz, which also corresponds to the prominent EEG rhythmic slow activity and spectral peak frequency.
Fig. 6.
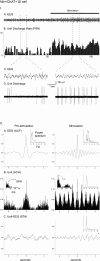
I. Discharge pattern of Nb+/ChAT+ neuron (#98812009/10) in the SI (see Fig. 3_B_). A, EEG (from retrosplenial cortex) and (B) peristimulus histogram (PSH) of the mean rate of discharge (in spikes per sec) before and during stimulation of the animal.C, EEG and (D) unit discharge traces are expanded for both prestimulation and stimulation conditions (left and right). Note the change from an irregular discharge pattern to a rhythmic burst-like discharge pattern in addition to the increased rate of discharge and in association with a change in EEG activity with stimulation. II. EEG and unit analysis during prestimulation and stimulation conditions. A, Autocorrelation functions (ACF; with correlation coefficients on vertical axes) of the prestimulation and stimulation EEG recordings and corresponding power spectra. B, Autocorrelation histograms (ACH; with correlation coefficients on vertical axes) of prestimulation and stimulation unit spike trains and insets of corresponding interspike interval histograms (ISIH). A power spectrum is shown (inset) for the stimulation ACH in which rhythmic activity is apparent. C, Spike-triggered averages (STA) of unit–EEG cross-correlation (with mV on vertical axes) for actual unit (black line) and randomized spike train (gray line). A power spectrum is shown (inset) for the stimulation STA in which the actual unit–EEG function was significantly different from the randomized spike train unit–EEG function (Wilcoxon test; *p < 0.05). Note with stimulation the appearance of cross-correlated EEG and unit rhythmic activity with a peak frequency of ∼2 Hz, which did not correspond to the prominent EEG rhythmic slow activity or spectral peak but did correspond to a secondary peak in the EEG power spectrum.
Fig. 7.
EEG and unit analysis for Nb+/ChAT+ MCPO neuron (#98o070021/23) during stimulation. A, Representative traces showing retrosplenial (RF) and prefrontal (PF) cortical leads recorded simultaneously with unit. B, Autocorrelation functions and histogram (ACF, ACH) of respective recordings. Note that the unit rhythmic discharge most closely matches the rhythmic activity of the prefrontal cortex. C, Power spectra of EEG leads and unit ACH indicating that the rhythmic discharge of the unit closely matches the dominant peak frequency of the prefrontal cortex, whereas it matches a secondary peak of the retrosplenial cortex.D, Spike-triggered averages (STA) of unit–EEG cross-correlation for both retrosplenial and prefrontal cortices (with normalized units on vertical axis) for actual unit (black line) and randomized spike train (gray line).
Fig. 8.
I. Discharge pattern of Nb+/ChAT− neuron (#98629000) in the MCPO (see Fig. 3_C_). A, EEG (from retrosplenial cortex) and (B) peristimulus histogram (PSH) of the mean rate of discharge (in spikes per sec) before and during stimulation of the animal.C, EEG and (D) unit discharge traces are expanded for both prestimulation and stimulation conditions (left and right). Note the change from an irregular discharge pattern to a tonic discharge pattern and slightly increased rate of discharge in association with a change in EEG activity with stimulation. II. EEG and unit analysis during prestimulation and stimulation conditions. A, Autocorrelation functions (ACF; with correlation coefficients on vertical axes) of the prestimulation and stimulation EEG recordings and corresponding power spectra. B, Autocorrelation histograms (ACH; with correlation coefficients on vertical axes) of prestimulation and stimulation unit spike trains and insets of corresponding interspike interval histograms (ISIH). C, Spike-triggered averages (STA) of unit–EEG cross-correlation (with mV on vertical axes) for actual unit (black line) and randomized spike train (gray line). Note the lack of low frequency rhythmic activity in the unit discharge and the absence of cross-correlated unit–EEG activity with stimulation.
Similar articles
- Neurotensin-induced bursting of cholinergic basal forebrain neurons promotes gamma and theta cortical activity together with waking and paradoxical sleep.
Cape EG, Manns ID, Alonso A, Beaudet A, Jones BE. Cape EG, et al. J Neurosci. 2000 Nov 15;20(22):8452-61. doi: 10.1523/JNEUROSCI.20-22-08452.2000. J Neurosci. 2000. PMID: 11069953 Free PMC article. - Cholinergic basal forebrain neurons burst with theta during waking and paradoxical sleep.
Lee MG, Hassani OK, Alonso A, Jones BE. Lee MG, et al. J Neurosci. 2005 Apr 27;25(17):4365-9. doi: 10.1523/JNEUROSCI.0178-05.2005. J Neurosci. 2005. PMID: 15858062 Free PMC article. - Activity, modulation and role of basal forebrain cholinergic neurons innervating the cerebral cortex.
Jones BE. Jones BE. Prog Brain Res. 2004;145:157-69. doi: 10.1016/S0079-6123(03)45011-5. Prog Brain Res. 2004. PMID: 14650914 Review. - Tonic and phasic influence of basal forebrain unit activity on the cortical EEG.
Détári L. Détári L. Behav Brain Res. 2000 Nov;115(2):159-70. doi: 10.1016/s0166-4328(00)00256-4. Behav Brain Res. 2000. PMID: 11000418 Review.
Cited by
- Cholinergic control in developing prefrontal-hippocampal networks.
Janiesch PC, Krüger HS, Pöschel B, Hanganu-Opatz IL. Janiesch PC, et al. J Neurosci. 2011 Dec 7;31(49):17955-70. doi: 10.1523/JNEUROSCI.2644-11.2011. J Neurosci. 2011. PMID: 22159110 Free PMC article. - A cell autonomous torsinA requirement for cholinergic neuron survival and motor control.
Pappas SS, Li J, LeWitt TM, Kim JK, Monani UR, Dauer WT. Pappas SS, et al. Elife. 2018 Aug 17;7:e36691. doi: 10.7554/eLife.36691. Elife. 2018. PMID: 30117805 Free PMC article. - Cell-specific modulation of plasticity and cortical state by cholinergic inputs to the visual cortex.
Sugihara H, Chen N, Sur M. Sugihara H, et al. J Physiol Paris. 2016 Sep;110(1-2):37-43. doi: 10.1016/j.jphysparis.2016.11.004. Epub 2016 Nov 10. J Physiol Paris. 2016. PMID: 27840211 Free PMC article. Review. - Discharge and Role of GABA Pontomesencephalic Neurons in Cortical Activity and Sleep-Wake States Examined by Optogenetics and Juxtacellular Recordings in Mice.
Cissé Y, Ishibashi M, Jost J, Toossi H, Mainville L, Adamantidis A, Leonard CS, Jones BE. Cissé Y, et al. J Neurosci. 2020 Jul 29;40(31):5970-5989. doi: 10.1523/JNEUROSCI.2875-19.2020. Epub 2020 Jun 23. J Neurosci. 2020. PMID: 32576622 Free PMC article. - Effect of cortical spreading depression on basal forebrain neurons.
Szentgyörgyi V, Balatoni B, Tóth A, Détári L. Szentgyörgyi V, et al. Exp Brain Res. 2006 Feb;169(2):261-5. doi: 10.1007/s00221-005-0321-6. Epub 2006 Jan 18. Exp Brain Res. 2006. PMID: 16418847
References
- Alonso A, Gaztelu JM, Buno W, Jr, Garcia-Austt E. Cross-correlation analysis of septohippocampal neurons during theta rhythm. Brain Res. 1987;413:135–146. - PubMed
- Alonso A, Khateb A, Fort P, Jones BE, Muhlethaler M. Differential oscillatory properties of cholinergic and noncholinergic nucleus basalis neurons in guinea pig brain slice. Eur J Neurosci. 1996;8:169–182. - PubMed
- Aston-Jones G, Shaver R, Dinan T. Cortically projecting nucleus basalis neurons in rat are physiologically heterogeneous. Neurosci Lett. 1984;46:19–24. - PubMed
- Bigl V, Woolf NJ, Butcher LL. Cholinergic projections from the basal forebrain to frontal, parietal, temporal, occipital, and cingulate cortices: a combined fluorescent tracer and acetyl cholinesterase analysis. Brain Res Bull. 1982;8:727–749. - PubMed
Publication types
MeSH terms
Substances
LinkOut - more resources
Full Text Sources

