Sint1, a common integration site in SL3-3-induced T-cell lymphomas, harbors a putative proto-oncogene with homology to the septin gene family - PubMed (original) (raw)
Sint1, a common integration site in SL3-3-induced T-cell lymphomas, harbors a putative proto-oncogene with homology to the septin gene family
A B Sørensen et al. J Virol. 2000 Mar.
Abstract
The murine retrovirus SL3-3 is a potent inducer of T-cell lymphomas when inoculated into susceptible newborn mice. Previously, DNAs from twenty SL3-3-induced tumors were screened by PCR for provirus integration sites. Two out of 20 tumors demonstrated clonal provirus insertion into a common region. This region has now been isolated and characterized. The region, named SL3-3 integration site 1 (Sint1), maps to the distal end of mouse chromosome 11, corresponding to human chromosome 17q25, and may be identical to a mouse mammary tumor virus integration site in a T-cell lymphoma, Pad3. Two overlapping genomic lambda clones spanning about 35 kb were isolated and used as a starting point for a search for genes in the neighborhood of the virus integration sites. A genomic fragment was used as a hybridization probe to isolate a 3-kb cDNA clone, the expression of which was upregulated in one of two tumors harboring a provirus in Sint1. The cDNA clone is predicted to encode a protein which shows 97.0% identity to a human septin-like protein encoded by a gene which has been found as a fusion partner gene of MLL in an acute myeloid leukemia with a t(11;17)(q23;q25). Together these findings raise the possibility that a proto-oncogene belonging to the septin family, and located about 15 kb upstream of the provirus integration sites, is involved in murine leukemia virus-induced T-cell lymphomagenesis.
Figures
FIG. 1
Primer positions for RT-PCR analyses. The 3.0-kb Sint1 cDNA is indicated as a line with the identified exon included as a shaded box. Arrows indicate positions and numbers of primers. The expected (brackets) and observed sizes of the PCR fragments are indicated. The PCR analyses were performed in two rounds (see Materials and Methods), and the products from the second PCR were analyzed by gel electrophoresis (not shown).
FIG. 2
(A) Relative locations and orientations of the integrated proviruses in two independent tumors (15 and 16). Box, preintegration site PCR probe A; arrows 1 and 2, primers used to amplify probe A; arrows a and b, provirus-specific primers; H, _Hin_dIII restriction site. (B) Restriction map of the cloned Sint1 locus. Upper lines indicate the two overlapping genomic λ-phage clones, while the bottom line shows the resulting map. _Sac_I (S), _Xho_I (X), _Pst_I (P), _Hin_dIII (H), and _Eco_RI (E) sites are indicated. Underlined are the CpG indicator enzymes (see text). Dotted lines, regions only partly analyzed by restriction enzyme mapping and sequencing; boxes A and B, hybridization probes; triangles, provirus integration sites.
FIG. 3
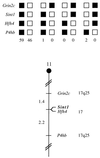
Sint1 maps in the distal region of mouse chromosome 11. Sint1 was placed on mouse chromosome 11 by interspecific backcross analysis. The segregation patterns of Sint1 and flanking genes in 108 backcross animals that were typed for all loci are shown at the top. For individual pairs of loci, more than 108 animals were typed (see text). Each column represents the chromosome identified in the backcross progeny that was inherited from the (C57BL/6J × M. spretus)F1 parent. Black, boxes, presence of a C57BL/6J allele; white boxes, presence of an M. spretus allele. The number of offspring inheriting each type of chromosome is listed at the bottom of each column. A partial chromosome 11 linkage map showing the location of Sint1 in relation to linked genes is shown at the bottom. Recombination distances between loci in centimorgans are shown to the left of the chromosome, and the positions of loci in human chromosomes, where known, are shown to the right. References for the human map positions of loci cited in this study can be obtained from the Genome Data Base, a computerized database of human linkage information maintained by the William H. Welch Medical Library of Johns Hopkins University (Baltimore, Md.).
FIG. 4
Northern blot analyses of Sint1 expression. All three panels are identical Northern blots hybridized with the probes indicated at the left. The blots contain about 2 μg of poly(A)+ RNA per lane from eight different mouse tissues (left) and from mouse embryos at different time points (right). Size markers (in kilobases) are at the left of each autoradiogram.
FIG. 5
Correlation between Sint1 genomic region and Sint1 cDNA. (Top) Part of the genomic region; (middle) genomic 3.5-kb _Hin_dIII/_Not_I subclone; (bottom) corresponding cDNA clone. Triangles, provirus integration sites. Restriction enzyme site abbreviations are as defined for Fig. 1. Hybridization probes are shown as boxes A, B, and C. The grey box containing an arrow indicates the location and orientation of the exon in the genomic clone as well as in the cDNA clone. The 5′ and 3′ splicing signal (ss) sequences are shown with the conserved intron dinucleotides underlined.
FIG. 6
Sint1 cDNA and predicted amino acid sequences. In the 3′-UTR, the AT degradation motifs are underlined and the polyadenylation site consensus sequence is boxed.
FIG. 7
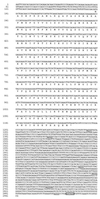
Comparison of the predicted amino acid sequences encoded by Sint1 cDNA and a human brain cDNA (KIAA0991; accession no., AB023208) or the human MSF cDNA (accession no., AF123052). The KIAA0991 and MSF sequences are 100% identical in the region shown. Boxed are the GTP-binding motifs. The sequences show 97.0% identity and 97.9% similarity (it should be noted, however, that the KIAA0991 and MSF sequences are 88 and 234 aa residues longer, respectively, than the Sint1 sequence). Alignment was performed with the Genetics Computer Group program BESTFIT. Vertical lines, identical residues; colons, well-conserved replacements that scored better than 0.5 in the PAM-250 matrix; dots, replacements scoring better than 0.1. The lengths of the Sint1, KIAA0991, and MSF sequences are 334, 422, and 568 aa, respectively.
FIG. 8
RNase protection assay. (Top) RNase protection of RNA from seven different SL3-3 MLV-induced tumors assayed with Sint1 and mouse β-actin RNA probes. Lane M, molecular DNA size markers (200, 300, 400, and 500 bp). Arrows indicate the protected fragments, the sizes of which are 325 bp for Sint1 and 210 bp for mouse β-actin. (Bottom) Localization of the Sint1 RNA probe as well as the Sint1/β-actin values after quantification of radioactive protected fragments in two experiments (experiment 2 is the one shown at the top).
Similar articles
- Stability of AML1 (core) site enhancer mutations in T lymphomas induced by attenuated SL3-3 murine leukemia virus mutants.
Amtoft HW, Sørensen AB, Bareil C, Schmidt J, Luz A, Pedersen FS. Amtoft HW, et al. J Virol. 1997 Jul;71(7):5080-7. doi: 10.1128/JVI.71.7.5080-5087.1997. J Virol. 1997. PMID: 9188573 Free PMC article. - Sequence tags of provirus integration sites in DNAs of tumors induced by the murine retrovirus SL3-3.
Sørensen AB, Duch M, Amtoft HW, Jørgensen P, Pedersen FS. Sørensen AB, et al. J Virol. 1996 Jun;70(6):4063-70. doi: 10.1128/JVI.70.6.4063-4070.1996. J Virol. 1996. PMID: 8648744 Free PMC article. - Genetic heterogeneity in acute myeloid leukemia: maximizing information flow from MuLV mutagenesis studies.
Largaespada DA. Largaespada DA. Leukemia. 2000 Jul;14(7):1174-84. doi: 10.1038/sj.leu.2401852. Leukemia. 2000. PMID: 10914539 Review. - Virus-host interactions and the pathogenesis of murine and human oncogenic retroviruses.
Tsichlis PN, Lazo PA. Tsichlis PN, et al. Curr Top Microbiol Immunol. 1991;171:95-171. doi: 10.1007/978-3-642-76524-7_5. Curr Top Microbiol Immunol. 1991. PMID: 1667631 Review. No abstract available.
Cited by
- Activation of the brain-specific neurogranin gene in murine T-cell lymphomas by proviral insertional mutagenesis.
Nielsen AA, Kjartansdóttir KR, Rasmussen MH, Sørensen AB, Wang B, Wabl M, Pedersen FS. Nielsen AA, et al. Gene. 2009 Aug 1;442(1-2):55-62. doi: 10.1016/j.gene.2009.04.003. Epub 2009 Apr 17. Gene. 2009. PMID: 19376211 Free PMC article. - Septin 9 isoform expression, localization and epigenetic changes during human and mouse breast cancer progression.
Connolly D, Yang Z, Castaldi M, Simmons N, Oktay MH, Coniglio S, Fazzari MJ, Verdier-Pinard P, Montagna C. Connolly D, et al. Breast Cancer Res. 2011 Aug 10;13(4):R76. doi: 10.1186/bcr2924. Breast Cancer Res. 2011. PMID: 21831286 Free PMC article. - Structure and function of Septin 9 and its role in human malignant tumors.
Sun J, Zheng MY, Li YW, Zhang SW. Sun J, et al. World J Gastrointest Oncol. 2020 Jun 15;12(6):619-631. doi: 10.4251/wjgo.v12.i6.619. World J Gastrointest Oncol. 2020. PMID: 32699577 Free PMC article. Review. - Identification of Notch1 as a frequent target for provirus insertional mutagenesis in T-cell lymphomas induced by leukemogenic mutants of mouse mammary tumor virus.
Yanagawa S, Lee JS, Kakimi K, Matsuda Y, Honjo T, Ishimoto A. Yanagawa S, et al. J Virol. 2000 Oct;74(20):9786-91. doi: 10.1128/jvi.74.20.9786-9791.2000. J Virol. 2000. PMID: 11000255 Free PMC article. - The Roles of Septins in Regulating Fission Yeast Cytokinesis.
Zheng S, Zheng B, Fu C. Zheng S, et al. J Fungi (Basel). 2024 Jan 30;10(2):115. doi: 10.3390/jof10020115. J Fungi (Basel). 2024. PMID: 38392788 Free PMC article. Review.
References
- Bird A P. CpG islands as gene markers in the vertebrate nucleus. Trends Genet. 1987;3:342–347.
- Bourne H R, Sanders D A, McCormick F. The GTPase superfamily: conserved structure and molecular mechanism. Nature. 1991;349:117–126. - PubMed
Publication types
MeSH terms
Substances
LinkOut - more resources
Full Text Sources
Other Literature Sources
Molecular Biology Databases


