Single-channel properties in endoplasmic reticulum membrane of recombinant type 3 inositol trisphosphate receptor - PubMed (original) (raw)
Single-channel properties in endoplasmic reticulum membrane of recombinant type 3 inositol trisphosphate receptor
D O Mak et al. J Gen Physiol. 2000 Mar.
Abstract
The inositol 1,4,5-trisphosphate receptor (InsP(3)R) is an intracellular Ca(2+)-release channel localized in endoplasmic reticulum (ER) with a central role in complex Ca(2+) signaling in most cell types. A family of InsP(3)Rs encoded by several genes has been identified with different primary sequences, subcellular locations, variable ratios of expression, and heteromultimer formation. This diversity suggests that cells require distinct InsP(3)Rs, but the functional correlates of this diversity are largely unknown. Lacking are single-channel recordings of the recombinant type 3 receptor (InsP(3)R-3), a widely expressed isoform also implicated in plasma membrane Ca(2+) influx and apoptosis. Here, we describe functional expression and single-channel recording of recombinant rat InsP(3)R-3 in its native membrane environment. The approach we describe suggests a novel strategy for expression and recording of recombinant ER-localized ion channels in the ER membrane. Ion permeation and channel gating properties of the rat InsP(3)R-3 are strikingly similar to those of Xenopus type 1 InsP(3)R in the same membrane. Using two different two-electrode voltage clamp protocols to examine calcium store-operated calcium influx, no difference in the magnitude of calcium influx was observed in oocytes injected with rat InsP(3)R-3 cRNA compared with control oocytes. Our results suggest that if cellular expression of multiple InsP(3)R isoforms is a mechanism to modify the temporal and spatial features of [Ca(2+)](i) signals, then it must be achieved by isoform-specific regulation or localization of various types of InsP(3)Rs that have relatively similar Ca(2+) permeation properties.
Figures
Figure 1
Expression of endogenous type 1 and recombinant type 3 InsP3 receptors in Xenopus oocytes. (A–F) Immunoblotted with Ab-3; (G–K) immunoblotted with Ab-1. (A) Western blot of lysate from an equivalent of one control oocyte, demonstrating lack of endogenous type 3 InsP3R expression; (B) Western blot of lysate from an equivalent of one r-InsP3R-3 cRNA-injected oocyte, demonstrating expression of the recombinant r-InsP3R-3 protein; (C) Western blot of type 3 InsP3R adsorbed nonspecifically to agarose beads, from lysate from fifteen control oocytes; (D) Western blot of type 3 InsP3R in InsP3R-1 immunoprecipitate, from lysate from fifteen control oocytes; (E) Western blot of type 3 InsP3R adsorbed nonspecifically to agarose beads, from lysate from fifteen cRNA-injected oocytes; (F) Western blot of type 3 InsP3R in InsP3R-1 immunoprecipitate from lysate, from fifteen cRNA-injected oocytes. Difference between F and E represents the amount of recombinant r-InsP3R-3 specifically immunoprecipitated with _X_-InsP3R-1. (G) Western blot of _X-_InsP3R-1 adsorbed nonspecifically to agarose beads, from lysate from fifteen control oocytes; (H) Western blot of _X-_InsP3R-1 in InsP3R-3 immunoprecipitate, from lysate from fifteen control oocytes. The InsP3R detected is most likely caused by cross-interaction of the immunoprecipitating Ab-3 with the large amount of endogenous _X_-InsP3R-1 present in the lysate from fifteen oocytes. (I) Western blot of _X-_InsP3R-1 adsorbed nonspecifically to agarose beads, from lysate from fifteen cRNA-injected oocytes; (J) Western blot _X-_InsP3R-1 in InsP3R-3 immunoprecipitate, from lysate from fifteen cRNA-injected oocytes. Difference in protein amounts between H/I and J represents the amount of _X_-InsP3R-1 specifically immunoprecipitated with recombinant r-InsP3R-3. (K) Western blot of _X-_InsP3R-1 in lysate from an equivalent of one control oocyte; (L) Western blot of _X-_InsP3R-1 in lysate from an equivalent of one cRNA-injected oocyte. Comparisons of K and L indicate that r-InsP3R-3 expression does not induce changes in the expression levels of the endogenous _X_-InsP3R-1. Western blots of type 1 InsP3R in InsP3R-1 immunoprecipitates or type 3 InsP3R in InsP3R-3 immunoprecipitates are not shown because too much protein was present in those lanes for the protein bands to be properly detected with the same exposure as the other lanes.
Figure 2
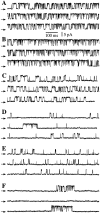
Current traces obtained by patch clamping the outer membrane of isolated oocyte nuclei in symmetric 0-mM Mg2+ solutions. All current records shown were obtained with Vapp = 20 mV, and with 0.5 mM free ATP and 10 μM InsP3 in the pipette solution. The arrows indicate the closed channel current level. (A, C, and E) Nuclei from r-InsP3R-3 cRNA-injected oocytes. (B, D, and F) Nuclei from uninjected oocytes. (A and B) [Ca2+]i = 1,150 nM. (C and D) [Ca2+]i = 80 nM. (E and F) [Ca2+]i = 57.5 μM. The average P o (±SEM) evaluated for n experiments under the shown experimental conditions are: (A) 0.75 ± 0.03 (n = 16); (B) 0.80 ± 0.02 (n = 8); (C) 0.45 ± 0.07 (n = 4); (D) 0.14 ± 0.03 (n = 7); (E) 0.23 ± 0.07 (n = 4); (F) 0.27 ± 0.11 (n = 6).
Figure 3
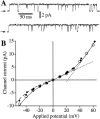
Conductance of the recombinant r-InsP3R-3 in the nuclear membrane. (A) Typical patch clamp current traces for r-InsP3R-3 channels in symmetric solutions containing 2.5 mM Mg2+ and [Ca2+]i = 940 nM. (B) I-V relation for the r-InsP3R-3 (•) in symmetric 2.5 mM Mg2+ solutions. Channel currents were averaged from all channel opening and closing events from five current records (over 100 events in each record). SEM bars are smaller than the symbols. I-V relation for the _X_-InsP3R-1 channels in the same ionic conditions (○) obtained previously (Mak and Foskett 1998) is also plotted for comparison. Solid curve is a fifth-order odd polynomial [I = a 1Vapp + a 3(Vapp)3 + a 5(Vapp)5] fitted to the r-InsP3R-3 data under positive Vapp. (Dotted line) The slope conductances (_d_I/_d_V) of 119 pS at 0 mV and 360 pS at 50 mV. Dashed curve: 0.7× the value of the solid curve.
Figure 5
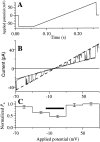
Channel properties of the r-InsP3R-3 in symmetric 0 mM Mg2+ solutions ([Ca2+]i = 80 nM) under a voltage ramp. (A) The applied voltage ramp used to obtain the current traces. (B) I-V relation obtained from a typical current trace using the voltage ramp. Dotted and dashed lines are the fitted closed and open channel I-V relations, respectively. The channel conductance was evaluated as the difference between the slopes of the two fitted lines. (C) Voltage dependence of P o of the r-InsP3R-3 channel. The P o of the channel observed at various Vapp during the voltage ramp was binned and averaged over 28 traces to generate the histogram. SEM of the P o is also plotted. The horizontal bar indicates the voltage range −15 to 15 mV in which channel openings and closings were difficult to discern, so P o was underestimated.
Figure 4
r-InsP3R-3 channel conductance fluctuates in the absence of Mg2+. (A) Current trace from a patch with two InsP3R-3 channels, one of which had fluctuating conductance, in symmetric solutions containing 0 mM Mg2+; [Ca2+]i = 221 nM. (B) Current trace showing two InsP3R-3 channels with conductance fluctuating in concert, with 2.5 mM Mg2+ on the pipette side and 0 mM Mg2+ on the bath side of the channel; [Ca2+]i = 1,260 nM.
Figure 6
Conductance substates of the InsP3R channels observed in nuclear patches obtained from r-InsP3R-3 cRNA-injected oocytes. (A) Current trace showing a transition of an InsP3R channel from the small (S) conductance state to the main (M) conductance state in symmetric solutions containing 0 mM Mg2+; [Ca2+]i = 1,150 nM. (B) Current trace showing an InsP3R channel in the rare half (H) conductance state in symmetric solutions containing 0 mM Mg2+; [Ca2+]i = 255 nM. (C) Current trace showing an InsP3R channel in the normal and flicker kinetic modes in symmetric 2.5 mM Mg2+; [Ca2+]i = 940 nM. F1 and F2 denote the conductance states in the flicker kinetic mode.
Figure 9
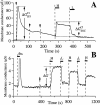
Store-operated calcium influx across the oocyte plasma membrane. Whole-cell transmembrane conductance of r-InsP3R-3 cRNA-injected Xenopus oocytes was recorded in two types of TEV experiments. (A) Ca2+-activated plasma membrane Cl− channel current after microinjection of InsP3 in various bathing solutions. Arrows indicate injections of InsP3 into the oocyte. Horizontal bars indicate exchange of bathing solution by perfusion with a high Ca2+ solution HCa96 (H) or a low Ca2+ solution LCa96 (L). The magnitudes of the changes in membrane conductance due to plasma membrane Ca2+-activated Cl− current response to InsP3 injection Δ_G_ IP3 Cland due to Ca2+ influx through store-operated Ca2+ channels Δ_G_ SOC Clare marked. (B) Store-operated Ca2+ currents after activation of InsP3R in various bathing solutions. Horizontal bars indicate exchange of bathing solution with high Ca2+ solution HCa96 (H), low Ca2+ solution LCa96 (L), and low Ca2+ LCa96 containing 1:100 fetal bovine serum (fbs). Arrow indicates microinjection of BAPTA. Magnitude of changes in membrane conductance due to Ca2+ influx through store-operated Ca2+ channels (Δ_G_) is indicated.
Figure 7
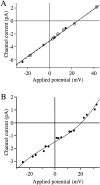
Ion selectivity of the r-InsP3R-3. (A) The I-V curve of the InsP3R-3 in the presence of solutions containing asymmetric K+ concentrations. The pipette contained the low K+ solution. The bath solution was the standard 140 mM KCl solution with 0 mM Mg2+. Vapp values were corrected for the liquid junction potential (Neher, 1992) between the asymmetric solutions across the membrane patch. Channel currents were obtained as in Fig. 3. • are data points for r-InsP3R-3 fitted with the dashed line, giving Vrev = 25.2 ± 0.7 mV. ○ are data points for _X_-InsP3R-1 fitted with the solid line, giving Vrev = 25.3 ± 0.2 mV. (B) The I-V curve of InsP3R-3 in the presence of a [Ca2+] gradient. The pipette contained the standard 140 mM KCl solution with 0 mM Mg2+ and [Ca2+]i = 24.7 nM. To avoid exposing the oocyte nucleus to high [Ca2+], which interferes with formation of giga-ohm seals (Mak and Foskett 1994), an excised patch with InsP3R activities was first obtained from a nucleus in the standard 140 mM KCl solution (0 mM Mg2+). The bath solution was then replaced with the high Ca2+ solution by perfusion. Vapp values were corrected for liquid junction potential (Neher, 1992) between the asymmetric solutions across the membrane patch. Channel currents were obtained as in Fig. 3. The solid curve is a fifth order polynomial fitted to the data points, giving Vrev = 20.6 ± 0.5 mV.
Figure 8
Histogram analysis of number of current levels (abscissa) observed in 767 nuclear patch clamp experiments using isolated nuclei from r-InsP3R-3 cRNA-injected oocytes (unshaded histogram with thick outline). Also plotted is the Poisson distribution (shaded histogram with thin outline) with the same mean current level number ≪_n_≫=2.016per patch. Note the different y-axis scales used in the histogram. The number of patches containing a large number of channels (6–15) exceeds that predicted from Poisson statistics, suggesting that the recombinant type 3 InsP3R channel localizes in clusters.
Similar articles
- Single-channel recordings of recombinant inositol trisphosphate receptors in mammalian nuclear envelope.
Boehning D, Joseph SK, Mak DO, Foskett JK. Boehning D, et al. Biophys J. 2001 Jul;81(1):117-24. doi: 10.1016/s0006-3495(01)75685-8. Biophys J. 2001. PMID: 11423400 Free PMC article. - ATP-dependent adenophostin activation of inositol 1,4,5-trisphosphate receptor channel gating: kinetic implications for the durations of calcium puffs in cells.
Mak DO, McBride S, Foskett JK. Mak DO, et al. J Gen Physiol. 2001 Apr;117(4):299-314. doi: 10.1085/jgp.117.4.299. J Gen Physiol. 2001. PMID: 11279251 Free PMC article. - Redoxing calcium from the ER.
Roderick HL, Bootman MD. Roderick HL, et al. Cell. 2005 Jan 14;120(1):4-5. doi: 10.1016/j.cell.2004.12.034. Cell. 2005. PMID: 15652474 Review. - Inositol 1,4,5-trisphosphate receptors in the endoplasmic reticulum: A single-channel point of view.
Mak DO, Foskett JK. Mak DO, et al. Cell Calcium. 2015 Jul;58(1):67-78. doi: 10.1016/j.ceca.2014.12.008. Epub 2014 Dec 18. Cell Calcium. 2015. PMID: 25555684 Free PMC article. Review.
Cited by
- Functional characterization of mammalian inositol 1,4,5-trisphosphate receptor isoforms.
Tu H, Wang Z, Nosyreva E, De Smedt H, Bezprozvanny I. Tu H, et al. Biophys J. 2005 Feb;88(2):1046-55. doi: 10.1529/biophysj.104.049593. Epub 2004 Nov 8. Biophys J. 2005. PMID: 15533917 Free PMC article. - Graded recruitment and inactivation of single InsP3 receptor Ca2+-release channels: implications for quantal [corrected] Ca2+release.
Ionescu L, Cheung KH, Vais H, Mak DO, White C, Foskett JK. Ionescu L, et al. J Physiol. 2006 Jun 15;573(Pt 3):645-62. doi: 10.1113/jphysiol.2006.109504. Epub 2006 Apr 27. J Physiol. 2006. PMID: 16644799 Free PMC article. - Inositol trisphosphate receptor and ion channel models based on single-channel data.
Gin E, Wagner LE, Yule DI, Sneyd J. Gin E, et al. Chaos. 2009 Sep;19(3):037104. doi: 10.1063/1.3184540. Chaos. 2009. PMID: 19792029 Free PMC article. - Quantal Ca2+ release mediated by very few IP3 receptors that rapidly inactivate allows graded responses to IP3.
Rossi AM, Riley AM, Dupont G, Rahman T, Potter BVL, Taylor CW. Rossi AM, et al. Cell Rep. 2021 Nov 2;37(5):109932. doi: 10.1016/j.celrep.2021.109932. Cell Rep. 2021. PMID: 34731613 Free PMC article.
References
- Amundson J., Clapham D. Calcium waves. Curr. Opin. Neurobiol. 1993;3:375–382. - PubMed
- Berridge M.J. Inositol trisphosphate and calcium signalling. Nature. 1993;361:315–325. - PubMed
- Berridge M.J. Inositol trisphosphate and calcium signaling. Ann. NY Acad. Sci. 1995;766:31–43. - PubMed
- Bezprozvanny I., Watras J., Ehrlich B.E. Bell-shaped calcium-response curves of Ins(1,4,5)P3- and calcium-gated channels from endoplasmic reticulum of cerebellum. Nature. 1991;351:751–754. - PubMed
Publication types
MeSH terms
Substances
Grants and funding
- R01 DK034804/DK/NIDDK NIH HHS/United States
- GM56328/GM/NIGMS NIH HHS/United States
- R37 GM056328/GM/NIGMS NIH HHS/United States
- R01 GM056328/GM/NIGMS NIH HHS/United States
- DK34804/DK/NIDDK NIH HHS/United States
LinkOut - more resources
Full Text Sources
Molecular Biology Databases
Miscellaneous

