Apolipoprotein E isoform-dependent amyloid deposition and neuritic degeneration in a mouse model of Alzheimer's disease - PubMed (original) (raw)
Apolipoprotein E isoform-dependent amyloid deposition and neuritic degeneration in a mouse model of Alzheimer's disease
D M Holtzman et al. Proc Natl Acad Sci U S A. 2000.
Abstract
Apolipoprotein E (apoE) alleles determine the age-adjusted relative risk (epsilon4 > epsilon3) for Alzheimer's disease (AD). ApoE may affect AD pathogenesis by promoting deposition of the amyloid-beta (Abeta) peptide and its conversion to a fibrillar form. To determine the effect of apoE on Abeta deposition and AD pathology, we compared APP(V717F) transgenic (TG) mice expressing mouse, human, or no apoE (apoE(-/-)). A severe, plaque-associated neuritic dystrophy developed in APP(V717F) TG mice expressing mouse or human apoE. Though significant levels of Abeta deposition also occurred in APP(V717F) TG, apoE(-/-) mice, neuritic degeneration was virtually absent. Expression of apoE3 and apoE4 in APP(V717F) TG, apoE(-/-) mice resulted in fibrillar Abeta deposits and neuritic plaques by 15 months of age and substantially (>10-fold) more fibrillar deposits were observed in apoE4-expressing APP(V717F) TG mice. Our data demonstrate a critical and isoform-specific role for apoE in neuritic plaque formation, a pathological hallmark of AD.
Figures
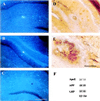
Figure 1
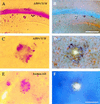
Neuritic plaques in APPV717F TG mice are thioflavine-S-positive. A section containing the hippocampus from a 12-month-old APPV717F +/− TG mouse [low power (A and B); high power (C and D)] and the temporal neocortex of an AD brain [high power (E and F)] were stained with the de Olmos silver degeneration method (A,C, and E), and the same sections were counterstained with thioflavine-S and visualized via epifluorescence microscopy with a UV filter (B, D, and_F_). Most of the neuritic plaques stained with this method had a thioflavine-S-positive core. [Bar in_B_ = 100 μm (A and_B_); bar in F = 17 μm (C_–_F).]
Figure 2
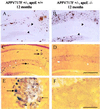
Aβ deposition and neuritic plaques in APPV717F TG mice in the presence and absence of apoE. Sections of the hippocampus from APPV717F +/−, apoE+/+ (A,C, and E) and APPV717F +/−, apoE−/− mice (B,D, and E) at 12 months of age were examined for Aβ IR (A and B) and the de Olmos silver degeneration method (C_–_F). Aβ-IR deposits were observed in the hippocampus of APPV717F TG mice in the presence (A) and absence (B) of apoE; however, the distribution of Aβ deposits within the hippocampus was different. The area between arrowheads in A and B is the molecular layer of the dentate gyrus. Both low- (C and_D_) and higher-power (E and_F_) photomicrographs within the hippocampus reveal the presence of numerous neuritic plaques only in the presence (C and E) as opposed to in the absence (D and F) of apoE. Arrows in_C_ point to neuritic plaques. Large arrow in_E_ points to a large, distended, dystrophic neurite in a plaque, and small arrow in E points to fine dystrophic neurites. [Bar in D = 180 μm (A_–_D); bar in F = 30 μm (E and F).]
Figure 3
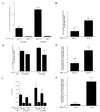
Quantitation of neuritic plaques, hippocampal Aβ, and thioflavine-S-positive deposits in APPV717F +/− TG mice expressing mouse, human, or no apoE. (A) Hippocampal neuritic plaques were prominent in APPV717F +/−, apoE+/+ mice at 12 months and increased by more than 3-fold by 15 months of age (n = 4, both time points). In APPV717F +/−, apoE−/− mice (n = 6, both time points), neuritic plaques were virtually absent and did not increase in number between 12 and 15 months of age (*, P < 0.0001 compared with apoE−/−). Neuritic plaques were identified with the de Olmos method. (B) The total volume of Aβ-IR deposits in the right hippocampus was determined in APPV717F +/− TG mice that were apoE+/+ (n = 4) or apoE−/− (n = 6) at 12 months of age and apoE+/+ (n = 4) or apoE−/− (n = 6) at 15 months of age. Volume of Aβ deposits was determined by using unbiased stereological methods. There was no statistical difference in the size of the right hippocampus between any of the groups of mice (data not shown). (C) Aβ ELISA for total Aβ and Aβ42 was assessed in the left hippocampus from the same mice used in A. *, P < 0.05, comparing apoE+/+ with apoE−/−. The total volume of Aβ-IR deposits in the right hippocampus (D) and in the molecular layer of dentate gyrus (E) was determined in APPV717F +/− TG mice that were either apoE3+/− (line 37, n = 6) or apoE4+/− (line 22, n = 9) at 15 months of age. Volume of Aβ deposits was determined by using unbiased stereological methods. There was no statistical difference in the size of the right hippocampus or the molecular layer of the dentate gyrus between the groups (data not shown). (F) The mean density of thioflavine-S-positive plaques was assessed in the molecular layer of the dentate gyrus of the same mice. *,P < 0.05 (D and E); *, P < 0.001, comparing apoE3+/− with apoE4+/− (F). Data in B, D,E, and F were log-transformed and tested for normality before statistical analysis.
Figure 4
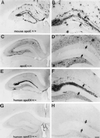
Human apoE restores the pattern of Aβ-IR deposits in the hippocampus of APPV717F +/− TG mice to that seen in animals expressing mouse apoE. Photomicrographs are shown of Aβ-IR deposits representative of the median values of their respective groups from APPV717F +/− TG mice either apoE+/+ (A and B), apoE−/− (C and D), apoE4+/− (E and F), or apoE3+/− (G and H) at 15 months of age. Although all mice expressing mouse apoE and some expressing human apoE at this age had Aβ-IR deposits in the molecular layer of the dentate gyrus (between arrowheads in B, D,F, and H), in the absence of apoE, Aβ-IR deposits were never observed in this layer. Significantly more E4-expressing (eight of nine, 89%) as compared with E3-expressing (two of six, 33%) mice developed Aβ deposition in the molecular layer. [Bar in H = 150 μm (A,C, E, and G) and 60 μm (B, D, F, and H).]
Figure 5
Fibrillar Aβ deposits and neuritic plaques develop in the presence of human apoE. Coronal sections through the hippocampus of an APPV717F +/−, apoE4+/− (A,B, D, and E) and an APPV717F +/−, apoE−/− mouse at 15 months of age were stained with thioflavine-S (A,B, and C) or the de Olmos silver degeneration method. Thioflavine-S-positive plaques were observed in the molecular layer of the dentate gyrus (A) and corpus callosum (B) of this apoE4-expressing mouse whereas no thioflavine-S-positive deposits were found in apoE−/− mice (C). In addition to fibrillar Aβ, neuritic plaques also were found in the hippocampus of apoE4-expressing mice (D and E). [Bar in C = 180 μm (A_–_D); bar in_E_ = 30 μm (E).] (F) Representative Western blot analysis of apoE, APP, and LRP in hippocampal lysates of APPV717F +/− TG mice expressing apoE3 (line 37) or apoE4 (line 22) at 15 months of age. There were no significant differences in the level of apoE, APP, or LRP between the apoE3- and apoE4-expressing mice, as shown here qualitatively or quantitatively assessed by densitometric analysis (data not shown).
Similar articles
- Apolipoprotein E isoforms in Alzheimer's disease pathology and etiology.
Baum L, Chen L, Ng HK, Pang CP. Baum L, et al. Microsc Res Tech. 2000 Aug 15;50(4):278-81. doi: 10.1002/1097-0029(20000815)50:4<278::AID-JEMT5>3.0.CO;2-T. Microsc Res Tech. 2000. PMID: 10936880 Review. - Apolipoprotein E is essential for amyloid deposition in the APP(V717F) transgenic mouse model of Alzheimer's disease.
Bales KR, Verina T, Cummins DJ, Du Y, Dodel RC, Saura J, Fishman CE, DeLong CA, Piccardo P, Petegnief V, Ghetti B, Paul SM. Bales KR, et al. Proc Natl Acad Sci U S A. 1999 Dec 21;96(26):15233-8. doi: 10.1073/pnas.96.26.15233. Proc Natl Acad Sci U S A. 1999. PMID: 10611368 Free PMC article. - Human and murine ApoE markedly alters A beta metabolism before and after plaque formation in a mouse model of Alzheimer's disease.
Fagan AM, Watson M, Parsadanian M, Bales KR, Paul SM, Holtzman DM. Fagan AM, et al. Neurobiol Dis. 2002 Apr;9(3):305-18. doi: 10.1006/nbdi.2002.0483. Neurobiol Dis. 2002. PMID: 11950276 - Apolipoprotein E facilitates neuritic and cerebrovascular plaque formation in an Alzheimer's disease model.
Holtzman DM, Fagan AM, Mackey B, Tenkova T, Sartorius L, Paul SM, Bales K, Ashe KH, Irizarry MC, Hyman BT. Holtzman DM, et al. Ann Neurol. 2000 Jun;47(6):739-47. Ann Neurol. 2000. PMID: 10852539 - Astrocyte lipoproteins, effects of apoE on neuronal function, and role of apoE in amyloid-beta deposition in vivo.
Fagan AM, Holtzman DM. Fagan AM, et al. Microsc Res Tech. 2000 Aug 15;50(4):297-304. doi: 10.1002/1097-0029(20000815)50:4<297::AID-JEMT9>3.0.CO;2-C. Microsc Res Tech. 2000. PMID: 10936884 Review.
Cited by
- Role of ABC transporters in the pathogenesis of Alzheimer's disease.
Abuznait AH, Kaddoumi A. Abuznait AH, et al. ACS Chem Neurosci. 2012 Nov 21;3(11):820-31. doi: 10.1021/cn300077c. Epub 2012 Oct 11. ACS Chem Neurosci. 2012. PMID: 23181169 Free PMC article. Review. - Oxidized cholesterol as the driving force behind the development of Alzheimer's disease.
Gamba P, Testa G, Gargiulo S, Staurenghi E, Poli G, Leonarduzzi G. Gamba P, et al. Front Aging Neurosci. 2015 Jun 19;7:119. doi: 10.3389/fnagi.2015.00119. eCollection 2015. Front Aging Neurosci. 2015. PMID: 26150787 Free PMC article. Review. - In Vivo Chimeric Alzheimer's Disease Modeling of Apolipoprotein E4 Toxicity in Human Neurons.
Najm R, Zalocusky KA, Zilberter M, Yoon SY, Hao Y, Koutsodendris N, Nelson M, Rao A, Taubes A, Jones EA, Huang Y. Najm R, et al. Cell Rep. 2020 Jul 28;32(4):107962. doi: 10.1016/j.celrep.2020.107962. Cell Rep. 2020. PMID: 32726626 Free PMC article. - Overexpression of low-density lipoprotein receptor in the brain markedly inhibits amyloid deposition and increases extracellular A beta clearance.
Kim J, Castellano JM, Jiang H, Basak JM, Parsadanian M, Pham V, Mason SM, Paul SM, Holtzman DM. Kim J, et al. Neuron. 2009 Dec 10;64(5):632-44. doi: 10.1016/j.neuron.2009.11.013. Neuron. 2009. PMID: 20005821 Free PMC article. - Blood-Brain Barrier: From Physiology to Disease and Back.
Sweeney MD, Zhao Z, Montagne A, Nelson AR, Zlokovic BV. Sweeney MD, et al. Physiol Rev. 2019 Jan 1;99(1):21-78. doi: 10.1152/physrev.00050.2017. Physiol Rev. 2019. PMID: 30280653 Free PMC article. Review.
References
- Selkoe D J. Science. 1997;275:630–631. - PubMed
- Lansbury P T J. Neuron. 1997;19:1151–1154. - PubMed
- Games D, Adams D, Alessandrini R, Barbour R, Berthelette P, Blackwell C, Carr T, Clemens J, Donaldson T, Gillespie F, et al. Nature (London) 1995;373:523–527. - PubMed
- Hsiao K, Chapman P, Nilsen S, Eckman C, Harigaya Y, Youkin S, Yang F, Cole G. Science. 1996;274:99–102. - PubMed
Publication types
MeSH terms
Substances
LinkOut - more resources
Full Text Sources
Other Literature Sources
Medical
Molecular Biology Databases
Miscellaneous
