Properties of lipid microdomains in a muscle cell membrane visualized by single molecule microscopy - PubMed (original) (raw)
Properties of lipid microdomains in a muscle cell membrane visualized by single molecule microscopy
G J Schütz et al. EMBO J. 2000.
Abstract
The lateral motion of single fluorescence labeled lipid molecules was imaged in native cell membranes on a millisecond time scale and with positional accuracy of approximately 50 nm, using 'single dye tracing'. This first application of single molecule microscopy to living cells rendered possible the direct observation of lipid-specific membrane domains. These domains were sensed by a lipid probe with saturated acyl chains as small areas in a liquid-ordered phase: the probe showed confined but fast diffusion, with high partitioning (approximately 100-fold) and long residence time (approximately 13 s). The analogous probe with mono-unsaturated chains diffused predominantly unconfined within the membrane. With approximately 15 saturated probes per domain, the locations, sizes, shapes and motions of individual domains became clearly visible. Domains had a size of 0.7 micrometer (0.2-2 micrometer), covering approximately 13% of total membrane area. Both the liquid-ordered phase characteristics and the sizes of domains match properties of membrane fractions described as detergent-resistant membranes (DRMs), strongly suggesting that the domains seen are the in vivo correlate of DRMs and thus may be identified as lipid rafts.
Figures
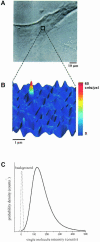
Fig. 1. Single lipid imaging in a cell membrane. (A) White light image of an HASM cell pre-treated with DOPE–Cy5 as probe lipid at a magnification of 40×. The square at the center of the cell indicates the area selected for fluorescence imaging. (B) The fluorescence image of this area was taken at 100× magnification, yielding a clearly resolved fluorescent peak of a single DOPE–Cy5 molecule. (C) Probability density of the single molecule fluorescence intensity taken from 933 observations of 291 molecules of DOPE–Cy5. The mean value of <_F_> = 161 ± 3 counts agrees perfectly with the value for the single molecule intensity measured in artificial lipid membranes. The low background signal (dotted line, ×10) allows for single molecule detection with a high signal-to-noise ratio of <S/N> = 23.
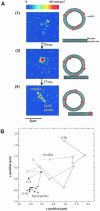
Fig. 2. Insertion of a single lipid probe molecule into the plasma membrane of an HASM cell. (A) The fluorescence image shows an area of 10 × 10 μm on the top surface of the cell. A very small number of vesicles containing DMPE–Cy5 as probe lipid were applied. In the first image, only a small fluorescence signal can be observed, corresponding to a vesicle entering the focal plane of the objective. After 70 ms, the vesicle, which can be observed as a bright spot, has attached to the membrane. After another 35 ms, a second, much smaller fluorescence signal appears, which represents the unitary intensity of a single DMPE–Cy5 molecule. (B) The trajectories of the lipid molecule (•) and the vesicle (○) have been constructed from a sequence of 14 consecutive images with a delay of 35 ms. Before lipid insertion, positions (2) and (3), vesicle and lipid probe are still co-localized. After insertion, positions (4)–(14), the two trajectories reveal a much higher mobility of the vesicle compared with the lipid molecule. The images corresponding to positions (3) and (4) are shown in (A).
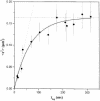
Fig. 3. Mobility of single DMPE–Cy5 lipid molecules. The mean square displacement, <_r_2>, as a function of the time lag shows saturation for _t_lag >100 ms. A total of 145 trajectories of different single molecules have been analyzed (•), yielding a diffusion constant D = 0.6 ± 0.04 μm2/s for lipid probe motion within the domain (dotted line) and a domain size of 700 ± 20 nm (dashed line), when the data are fitted to the model of restricted diffusion (solid line). Mean square displacements of 43 molecules for alternating short (12 ms) and long (212 ms) time lags are included (▪).
Fig. 4. Mobility of single DOPE–Cy5 lipid molecules. The mean square displacement, <_r_2>, as a function of the time lag is shown for the data from 291 single molecule trajectories. In the insert, a double-logarithmic plot of the apparent diffusion constant _D_app = 〈_r_2〉/4_t_lag is shown as a function of the time lag. It is fitted to the model of anomalous subdiffusion 〈_r_2〉 ∝ _t a_lag (full line in both graphs) yielding an exponent α = 0.87 ± 0.02.
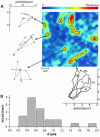
Fig. 5. Single domain imaging. (A) The image was taken at the top surface of an HASM cell after insertion of a high concentration of DMPE–Cy5 as probe lipid. Single domains can clearly be observed as bright fluorescent areas, containing on average ∼15 lipid probe molecules. For illustration, each domain was highlighted by a black contour line drawn at the half-maximum value of the respective fluorescence intensity. The mobility of individual domains was analyzed by determining the position of the domain center on consecutive images, as shown for three domains (left). The delay between two observations was set to 13 s. Uni-directional rotation has been observed for the domain at the bottom of the image, as exemplified for images 4, 7 and 10 by domain contours. (B) Histogram of the estimated domain diameters (see the text).
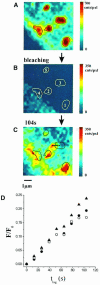
Fig. 6. Single domain FRAP. (A) FRAP was studied for the domains seen. (B) An area of 8 μm was bleached, which contained the image area. Recovery of the fluorescence due to lipid probe diffusion into the bleached area was monitored every 13 s. The image (C) shows fluorescence recovery after 104 s. (D) The fluorescence recovery of domain 1 (•) and 2 (○) was analyzed by determining the intensity every 13 s by integrating over the domain area (black contour). For comparison, the fluorescence recovery within the whole image area is included (▴). All values (F) were normalized to the respective initial value (_F_0) obtained from (A). In (C), the trajectory of the center of domain 3 is included, showing uni-directional motion.
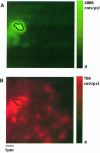
Fig. 7. Two-color imaging of DMPE-TMR (A) and DOPE–Cy5 (B). Each image represents the average of five consecutive images in a sequence of 10 images (_t_ill = 5 ms) for alternating excitation wavelengths of 528 nm (selective excitation of DMPE-TMR) and 633 nm (selective excitation of DOPE–Cy5). This allows simultaneous imaging of DMPE-TMR in lipid domains (A), and of the distribution of DOPE–Cy5 (B). Only a slight increase in fluorescence intensity at the respective location of the domain (indicated by the dashed line) can be found [note the different scales in (A) and (B)]. Intensity variations observable in (B) are expected for this low concentration regime due to statistical fluctuations of the local number of DOPE–Cy5 molecules. Analysis of the number of lipid probes per diffraction-limited area yields a Poisson distribution with a variance of 2.1 probes/4 pixels, which is in good agreement with the mean density of 9 probes/μm2, providing further evidence for a random distribution of the probe.
Similar articles
- Visualizing lipid structure and raft domains in living cells with two-photon microscopy.
Gaus K, Gratton E, Kable EP, Jones AS, Gelissen I, Kritharides L, Jessup W. Gaus K, et al. Proc Natl Acad Sci U S A. 2003 Dec 23;100(26):15554-9. doi: 10.1073/pnas.2534386100. Epub 2003 Dec 12. Proc Natl Acad Sci U S A. 2003. PMID: 14673117 Free PMC article. - Structure of detergent-resistant membrane domains: does phase separation occur in biological membranes?
Brown DA, London E. Brown DA, et al. Biochem Biophys Res Commun. 1997 Nov 7;240(1):1-7. doi: 10.1006/bbrc.1997.7575. Biochem Biophys Res Commun. 1997. PMID: 9367871 Review. - Some new faces of membrane microdomains: a complex confocal fluorescence, differential polarization, and FCS imaging study on live immune cells.
Gombos I, Steinbach G, Pomozi I, Balogh A, Vámosi G, Gansen A, László G, Garab G, Matkó J. Gombos I, et al. Cytometry A. 2008 Mar;73(3):220-9. doi: 10.1002/cyto.a.20516. Cytometry A. 2008. PMID: 18163467 - Partitioning of dual-lipidated peptides into membrane microdomains: lipid sorting vs peptide aggregation.
Janosch S, Nicolini C, Ludolph B, Peters C, Völkert M, Hazlet TL, Gratton E, Waldmann H, Winter R. Janosch S, et al. J Am Chem Soc. 2004 Jun 23;126(24):7496-503. doi: 10.1021/ja049922i. J Am Chem Soc. 2004. PMID: 15198596 - Applications of fluorescence lifetime spectroscopy and imaging to lipid domains in vivo.
Bastos AE, Scolari S, Stöckl M, Almeida RF. Bastos AE, et al. Methods Enzymol. 2012;504:57-81. doi: 10.1016/B978-0-12-391857-4.00003-3. Methods Enzymol. 2012. PMID: 22264529 Review.
Cited by
- Kinesin KIFC1 actively transports bare double-stranded DNA.
Farina F, Pierobon P, Delevoye C, Monnet J, Dingli F, Loew D, Quanz M, Dutreix M, Cappello G. Farina F, et al. Nucleic Acids Res. 2013 May;41(9):4926-37. doi: 10.1093/nar/gkt204. Epub 2013 Mar 29. Nucleic Acids Res. 2013. PMID: 23543461 Free PMC article. - Quantitative scheme for full-field polarization rotating fluorescence microscopy using a liquid crystal variable retarder.
Lesoine JF, Lee JY, Krogmeier JR, Kang H, Clarke ML, Chang R, Sackett DL, Nossal R, Hwang J. Lesoine JF, et al. Rev Sci Instrum. 2012 May;83(5):053705. doi: 10.1063/1.4717682. Rev Sci Instrum. 2012. PMID: 22667623 Free PMC article. - Myelin basic protein-dependent plasma membrane reorganization in the formation of myelin.
Fitzner D, Schneider A, Kippert A, Möbius W, Willig KI, Hell SW, Bunt G, Gaus K, Simons M. Fitzner D, et al. EMBO J. 2006 Nov 1;25(21):5037-48. doi: 10.1038/sj.emboj.7601376. Epub 2006 Oct 12. EMBO J. 2006. PMID: 17036049 Free PMC article. - Quantifying biomolecule diffusivity using an optimal Bayesian method.
Voisinne G, Alexandrou A, Masson JB. Voisinne G, et al. Biophys J. 2010 Feb 17;98(4):596-605. doi: 10.1016/j.bpj.2009.10.051. Biophys J. 2010. PMID: 20159156 Free PMC article. - Elastic membrane heterogeneity of living cells revealed by stiff nanoscale membrane domains.
Roduit C, van der Goot FG, De Los Rios P, Yersin A, Steiner P, Dietler G, Catsicas S, Lafont F, Kasas S. Roduit C, et al. Biophys J. 2008 Feb 15;94(4):1521-32. doi: 10.1529/biophysj.107.112862. Epub 2007 Nov 2. Biophys J. 2008. PMID: 17981897 Free PMC article.
References
- Ahmed S.N., Brown, D.A. and London, E. (1997) On the origin of sphingolipid/cholesterol rich detergent-insoluble cell membranes: physiological concentrations of cholesterol and sphingolipid induce formation of a detergent-insoluble, liquid-ordered lipid phase in model membranes. Biochemistry, 36, 10944–10953. - PubMed
- Almeida P.F.F., Vaz, W.L.C. and Thompson, T.E. (1992) Lateral diffusion in the liquid phases of dimyristoylphosphatidylcholine/cholesterol lipid bilayers: a free volume analysis. Biochemistry, 31, 6739–6747. - PubMed
- Anderson R.G. (1998) The caveolae membrane system. Annu. Rev. Biochem., 67, 199–225. - PubMed
- Anderson R.G., Kamen, B.A., Rothenberg, K.G. and Lacey, S.W. (1992) Potocytosis: sequestration and transport of small molecules by caveolae. Science, 255, 410–411. - PubMed
- Atkins P.W. (1978) Physical Chemistry. Oxford University Press, Oxford, UK.
Publication types
MeSH terms
Substances
LinkOut - more resources
Full Text Sources
Other Literature Sources
