Environment-dependent residue contact energies for proteins - PubMed (original) (raw)
Environment-dependent residue contact energies for proteins
C Zhang et al. Proc Natl Acad Sci U S A. 2000.
Abstract
We examine the interactions between amino acid residues in the context of their secondary structural environments (helix, strand, and coil) in proteins. Effective contact energies for an expanded 60-residue alphabet (20 aa x three secondary structural states) are estimated from the residue-residue contacts observed in known protein structures. Similar to the prototypical contact energies for 20 aa, the newly derived energy parameters reflect mainly the hydrophobic interactions; however, the relative strength of such interactions shows a strong dependence on the secondary structural environment, with nonlocal interactions in beta-sheet structures and alpha-helical structures dominating the energy table. Environment-dependent residue contact energies outperform existing residue pair potentials in both threading and three-dimensional contact prediction tests and should be generally applicable to protein structure prediction.
Figures
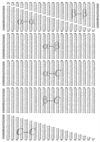
Figure 1
Secondary structural ERCE (in RT units). The energy parameters are divided into six groups, α-α, β-β, α-β, α-C, β-C, and_C_-C, where α, β, and C represent helix, strand, and coil states, respectively.
Figure 2
Contact prediction using three different potentials: MJ, JS, and ERCE. ERCE predictions based on predicted (ERCE-Pred) and real secondary structures (ERCE-Real) both are shown. The x axis indicates the fraction of experimentally determined contacts that are correctly predicted (defined here as the coverage). Each coverage value_x_ corresponds to an energy cutoff such that the percentage of native contacts whose energies are lower than the cutoff happens to be x. There are other residue pairs that do not form contacts in the native protein structure but also have energies lower than the cutoff. The fraction of predicted contacts that correspond to actually observed contacts define the accuracy. Here we compare different prediction methods with a common standard: the random prediction. In theory, the accuracy of a random prediction averaged over many trials equals the ratio of native contacts to the number of all possible residue pairs in a protein. This value varies with protein size and contact density. For each method, the y axis indicates how much more accurate the prediction is relative to that from a random method.
Similar articles
- Residue-residue potentials with a favorable contact pair term and an unfavorable high packing density term, for simulation and threading.
Miyazawa S, Jernigan RL. Miyazawa S, et al. J Mol Biol. 1996 Mar 1;256(3):623-44. doi: 10.1006/jmbi.1996.0114. J Mol Biol. 1996. PMID: 8604144 - An empirical energy function for threading protein sequence through the folding motif.
Bryant SH, Lawrence CE. Bryant SH, et al. Proteins. 1993 May;16(1):92-112. doi: 10.1002/prot.340160110. Proteins. 1993. PMID: 8497488 - Free energies of amino acid side-chain rotamers in alpha-helices, beta-sheets and alpha-helix N-caps.
Stapley BJ, Doig AJ. Stapley BJ, et al. J Mol Biol. 1997 Sep 26;272(3):456-64. doi: 10.1006/jmbi.1997.1250. J Mol Biol. 1997. PMID: 9325103 - Inter-residue interactions in protein folding and stability.
Gromiha MM, Selvaraj S. Gromiha MM, et al. Prog Biophys Mol Biol. 2004 Oct;86(2):235-77. doi: 10.1016/j.pbiomolbio.2003.09.003. Prog Biophys Mol Biol. 2004. PMID: 15288760 Review. - Atomic environment energies in proteins defined from statistics of accessible and contact surface areas.
Delarue M, Koehl P. Delarue M, et al. J Mol Biol. 1995 Jun 9;249(3):675-90. doi: 10.1006/jmbi.1995.0328. J Mol Biol. 1995. PMID: 7783220 Review.
Cited by
- Fold prediction of helical proteins using torsion angle dynamics and predicted restraints.
Zhang C, Hou J, Kim SH. Zhang C, et al. Proc Natl Acad Sci U S A. 2002 Mar 19;99(6):3581-5. doi: 10.1073/pnas.052003799. Proc Natl Acad Sci U S A. 2002. PMID: 11904420 Free PMC article. - DECK: Distance and environment-dependent, coarse-grained, knowledge-based potentials for protein-protein docking.
Liu S, Vakser IA. Liu S, et al. BMC Bioinformatics. 2011 Jul 11;12:280. doi: 10.1186/1471-2105-12-280. BMC Bioinformatics. 2011. PMID: 21745398 Free PMC article. - From isotropic to anisotropic side chain representations: comparison of three models for residue contact estimation.
Sun W, He J. Sun W, et al. PLoS One. 2011 Apr 28;6(4):e19238. doi: 10.1371/journal.pone.0019238. PLoS One. 2011. PMID: 21552527 Free PMC article. - ANDIS: an atomic angle- and distance-dependent statistical potential for protein structure quality assessment.
Yu Z, Yao Y, Deng H, Yi M. Yu Z, et al. BMC Bioinformatics. 2019 Jun 3;20(1):299. doi: 10.1186/s12859-019-2898-y. BMC Bioinformatics. 2019. PMID: 31159742 Free PMC article. - Characteristics of protein residue-residue contacts and their application in contact prediction.
Wozniak PP, Kotulska M. Wozniak PP, et al. J Mol Model. 2014 Nov;20(11):2497. doi: 10.1007/s00894-014-2497-9. Epub 2014 Nov 6. J Mol Model. 2014. PMID: 25374390 Free PMC article.
References
- Levitt M. J Mol Biol. 1976;104:59–107. - PubMed
- Jernigan R L, Bahar I. Curr Opin Struct Biol. 1996;6:195–209. - PubMed
- Thomas P D, Dill K A. J Mol Biol. 1996;257:457–469. - PubMed
Publication types
MeSH terms
LinkOut - more resources
Full Text Sources
Other Literature Sources

