Dynamics of the endoplasmic reticulum and golgi apparatus during early sea urchin development - PubMed (original) (raw)
Dynamics of the endoplasmic reticulum and golgi apparatus during early sea urchin development
M Terasaki. Mol Biol Cell. 2000 Mar.
Free PMC article
Abstract
The endoplasmic reticulum (ER) and Golgi were labeled by green fluorescent protein chimeras and observed by time-lapse confocal microscopy during the rapid cell cycles of sea urchin embryos. The ER undergoes a cyclical microtubule-dependent accumulation at the mitotic poles and by photobleaching experiments remains continuous through the cell cycle. Finger-like indentations of the nuclear envelope near the mitotic poles appear 2-3 min before the permeability barrier of the nuclear envelope begins to change. This permeability change in turn is approximately 30 s before nuclear envelope breakdown. During interphase, there are many scattered, disconnected Golgi stacks throughout the cytoplasm, which appear as 1- to 2-microm fluorescent spots. The number of Golgi spots begins to decline soon after nuclear envelope breakdown, reaches a minimum soon after cytokinesis, and then rapidly increases. At higher magnification, smaller spots are seen, along with increased fluorescence in the ER. Quantitative measurements, along with nocodazole and photobleaching experiments, are consistent with a redistribution of some of the Golgi to the ER during mitosis. The scattered Golgi coalesce into a single large aggregate during the interphase after the ninth embryonic cleavage; this is likely to be preparatory for secretion of the hatching enzyme during the following cleavage cycle.
Figures
Figure 1
(A) Changes in ER organization during the cell cycle of sea urchin embryo blastomeres expressing GFP-KDEL. Images were obtained at 10.2-s intervals as the blastomeres went through the sixth cleavage; the timing for images shown is indicated. The embryo was oriented with the animal pole next to the coverslip, as in all other figures. The middle blastomere in the top row is shown in the next panel. (B) Closer-spaced time intervals (1 min) of the blastomere denoted in A to show the progression of ER accumulation at mitotic poles. The first image is soon after the nucleus has begun to reform. The image at the end of the top row is 20 s before the first image of A, whereas the second to last image of the bottom row is 10 s after the third image of A. (C) Nocodazole (1 μM) was perfused into the injection chamber during the interphase after the sixth cleavage of another embryo. The cells were imaged 25 min after perfusion, when it was clear that the mitotic cycle had been halted. Bars, 10 μm.
Figure 2
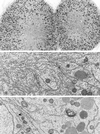
Electron microscopy of ER and Golgi in sea urchin embryos (5 h after fertilization). Top panel, ER is accumulated in the region of the mitotic poles. Yolk platelets (large, dark-staining organelles) are excluded, but some mitochondria are present (magnification, 2070×). Middle panel, higher-magnification view of the accumulated ER in the region of a mitotic pole (magnification, 21,360×). Bottom panel, typical appearance of a Golgi stack. Golgi stacks are scattered throughout the cytoplasm and do not appear to be connected. The Golgi stack shown here is ∼1.2 μm long in its widest dimension. The nucleus is seen on the left, indicating that this blastomere was fixed during interphase (magnification, 18,000×).
Figure 3
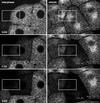
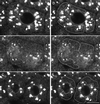
Evidence that the ER is continuous during mitosis. Blastomeres expressing GFP-KDEL in interphase or metaphase were repetitively bleached using a FLIP protocol. The top panels show the blastomeres before bleaching. The cells were subjected to nine bleach cycles. The confocal microscope was set at 3.1 s per scan. Each cycle consisted of three bleaching scans at high zoom with high laser intensity, followed by one imaging scan at low zoom with low laser intensity, followed by a 10-s wait period. The duration of each cycle was ∼20 s. The total elapsed time for the nine cycles was 2 min 51 s. The middle panels were taken after the fourth bleach (1 min 12 s), and the bottom panels were taken after the ninth bleach (2 min 51 s). The rectangles show the regions that were bleached. Because fluorescence throughout the cell was bleached by this protocol, it is likely that the GFP KDEL is present in a continuous compartment throughout the cell. Bar, 10 μm.
Figure 4
Evidence that the nuclear envelope projections occur before changes in the nuclear envelope permeability barrier. An egg was injected with both a DiI-saturated oil drop to label the ER and with FDx to monitor nuclear envelope permeability. DiI-labeled, finger-like membrane projections protude into the nucleus before NEBD. DiI and 70-kDa FDx were imaged alternately, every 5 s. The DiI images were taken 5 s previous to the 70-kDa FDx image on the same row. The time in seconds from the beginning of the 70-kDa FDx sequence is indicated. The graph shows the average fluorescence intensity measured in a rectangle of 6.6 × 8.4 μm centered in the nuclear region. Letters on the graph indicate which panel of the figure corresponds to data points on the graph. The 70-kDa FDx begins to enter the nucleus in D, whereas the projections are present ∼2 min earlier in B. Bar, 10 μm.
Figure 5
Labeling of Golgi by GFP chimeras. (A) To monitor the time course of GFP increase, eggs were injected with a mixture of mRNA coding for Galtase-GFP and Rh dextran and then fertilized. A ratio was formed of the GFP to Rh fluorescence. Images were taken with a 10× lens with the confocal aperture open to collect as much of the total fluorescence as possible. There was a lag of 2 h followed by a linear increase in fluorescence. Closed and open circles represent two different embryos in the same experiment. (B) An egg was injected with mRNA coding for KDELRm-GFP and then fertilized and imaged after fluorescence had developed. Confocal optical section of a blastomere at the 64-cell stage (between the sixth and seventh cleavages) shows fluorescent spots of varying sizes distributed throughout the cytoplasm. (C) Stereo pair made from a z series sequence containing the section on the left (39 steps with an interval of 0.54 μm). Bar, 10 μm.
Figure 6
Time-lapse sequence of the Golgi during mitosis. (A) Images of KDELRm-GFP were obtained every 30 s during the seventh cleavage; the timing of the images shown is indicated. (B) Time course of the number of Golgi spots in three different blastomeres. There was some uncertainty in counting. The Golgi that were located farther away from the focal plane gave rise to a progressively more hazy image, and sometimes it was difficult to determine whether an image corresponded to one or two separate Golgi. During interphase, the spots probably correspond to stacks seen by electron microscopy (Figure 2), but the average size of the spots is smaller during mitosis, and it is not known what they correspond toultrastructurally. Last, with this magnification, illumination level, and acquisition settings, the smaller spots seen in Figure 8 were not visible. For the measurements shown here, the spots counted were ≥1 μm in dimension and had a distinct outline. The data document a general trend, which is that the number of Golgi spots begins to decrease soon after NEBD, is at a minimum soon after cytokinesis is completed, and increases rapidly afterward. The original data are shown at
. The top graph contains data from the cell shown in the image sequence. Bar, 10 μm.
Figure 7
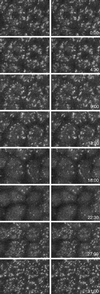
Time sequence of z series during mitosis of an embryo expressing KDELRm-GFP. z series sequences were obtained at 45-s intervals during the seventh cleavage and consisted of 11 sections 2 μm apart. Every sixth z series is shown here (4.5-min intervals). The z series stack for each time point has been projected as a stereo pair. This sequence shows that the decrease in the number of Golgi in one optical section seen in Figure 5 corresponds to a decrease in the number of Golgi throughout the cell rather than a redistribution of the Golgi out of the plane of the optical section.
Figure 8
Higher magnification of Galtase-GFP during mitosis. Cells were imaged with a 63× NA 1.4 objective lens as in Figure 5 but at zoom 3 instead of zoom 1. In addition, the laser illumination level was increased threefold, and the length of time for collecting fluorescence emission per pixel was increased threefold, so that the brightness of the image was increased ∼10-fold. As a consequence, the fluorescence from the Golgi was saturated, but the ER and other staining could be observed. The images are a two-frame average (slow scan = 3.1 s per frame) and are part of a sequence taken at 30-s intervals (the complete sequence can be viewed at
http://terasaki.uchc.edu/mitosis
). (A) Interphase, 6 min 30 s before NEBD of the seventh cleavage occurred. (B) Fifteen minutes after the first image, using identical instrument settings. Golgi spots of interphase cells are no longer prominent, but smaller spots are present throughout the cytoplasm. The ER pattern also appears to be brighter. (C) Twenty-four minutes after the first image. (D–F) The average fluorescence was determined within regions that contained only ER profiles. These areas excluded spots and were intended to measure Galtase-GFP fluorescence in the ER. (G) Average fluorescence versus time for each time point of this image sequence, using area tracings similar to that shown in D–F. The first time point corresponds to A and D, and the last time point corresponds to C and F. The data were used for calculating the ratio of fluorescence in the ER of untreated mitotic versus interphase cells. Bar, 10 μm.
Figure 9
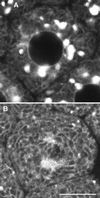
Galtase-GFP distribution in blastomeres arrested in prometaphase. (A) Interphase, 6 min after nuclei reformed after the sixth cleavage. The seawater in the chamber was changed to seawater containing 1 μM nocodazole 2 min 30 s after this image was taken. (B) Thirty-six minutes after nocodazole. To monitor the effect of nocodazole, the embryo was imaged at low magnification, low laser illumination at 30-s intervals. NEBD of the seventh cleavage occurred ∼11 min after nocodazole was added to the chamber. The blastomere was imaged with identical laser intensity and instrument settings as in A. The fluorescence pattern appears to be coming largely from the ER, which is brighter than in the interphase cells. There are some bright spots scattered throughout the cell, but they are much fewer and smaller than in interphase cells. Bar, 10 μm.
Figure 10
The fluorescence from Galtase-GFP in a nocodazole-treated (1 μM) treated blastomere was bleached using a FLIP protocol. The image quality is poorer than that shown in Figure 8, because lower illumination levels were used to minimize bleaching. Photobleaching using a FLIP protocol was begun 52 min after nocodazole was added. The protocol was essentially the same as used in Figure 3, except that the wait period was 20 s instead of 10 s, and the relative zoom of bleached to imaged was 6 instead of 5. The duration of each cycle was 30 s, and the total elapsed time for the 10 cycles was 5 min. Fluorescence was diminished throughout the cell, providing strong evidence that Galtase-GFP is in the ER. The size of the field imaged was 59 × 39 μm, and the bleached area was 12 × 7 μm and is indicated by the rectangle. Bar, 10 μm.
Figure 11
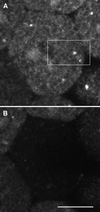
Effect of brefeldin A on Galtase GFP distribution. Seawater containing brefeldin A (5 μg/ml) was put into the chamber between the sixth and seventh cleavages. (A) Control image taken 4 min 30 s before change to brefeldin A. (B) Same region 36 min 30 s after brefeldin A. The blastomere has gone through the seventh cleavage, showing that brefeldin A does not block mitosis. Most of the Galtase GFP appears to be in the ER, and very few if any Golgi spots are present. Bar, 10 μm.
Figure 12
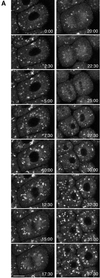
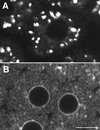
(A) Low-magnification view of a whole embryo showing the Golgi after the 10th cleavage. The scattered spots in the cytoplasm have become a single aggregate in each cell. By focusing through the embryo, these aggregates were seen to be located at the apical side of each nucleus. This organization is first seen after the ninth cleavage. Bar, 10 μm. (B) Mitosis of apical Golgi. Images were obtained every 17 s during the 10th cleavage. Images shown are at 4-min 15-s intervals. The Golgi spreads from its compact organization and then becomes diffuse as the cell goes through mitosis. The Golgi then returns to its original organization after the cell has cleaved. Bar, 5 μm.
Similar articles
- An ordered inheritance strategy for the Golgi apparatus: visualization of mitotic disassembly reveals a role for the mitotic spindle.
Shima DT, Cabrera-Poch N, Pepperkok R, Warren G. Shima DT, et al. J Cell Biol. 1998 May 18;141(4):955-66. doi: 10.1083/jcb.141.4.955. J Cell Biol. 1998. PMID: 9585414 Free PMC article. - Dynamics of the endoplasmic reticulum during early development of Drosophila melanogaster.
Bobinnec Y, Marcaillou C, Morin X, Debec A. Bobinnec Y, et al. Cell Motil Cytoskeleton. 2003 Mar;54(3):217-25. doi: 10.1002/cm.10094. Cell Motil Cytoskeleton. 2003. PMID: 12589680 - Recycling of golgi-resident glycosyltransferases through the ER reveals a novel pathway and provides an explanation for nocodazole-induced Golgi scattering.
Storrie B, White J, Röttger S, Stelzer EH, Suganuma T, Nilsson T. Storrie B, et al. J Cell Biol. 1998 Dec 14;143(6):1505-21. doi: 10.1083/jcb.143.6.1505. J Cell Biol. 1998. PMID: 9852147 Free PMC article. - Partitioning of cytoplasmic organelles during mitosis with special reference to the Golgi complex.
Thyberg J, Moskalewski S. Thyberg J, et al. Microsc Res Tech. 1998 Mar 1;40(5):354-68. doi: 10.1002/(SICI)1097-0029(19980301)40:5<354::AID-JEMT3>3.0.CO;2-R. Microsc Res Tech. 1998. PMID: 9527046 Review. - Role of microtubules in the organization of the Golgi complex.
Thyberg J, Moskalewski S. Thyberg J, et al. Exp Cell Res. 1999 Feb 1;246(2):263-79. doi: 10.1006/excr.1998.4326. Exp Cell Res. 1999. PMID: 9925741 Review.
Cited by
- Phosphoregulation of STIM1 leads to exclusion of the endoplasmic reticulum from the mitotic spindle.
Smyth JT, Beg AM, Wu S, Putney JW Jr, Rusan NM. Smyth JT, et al. Curr Biol. 2012 Aug 21;22(16):1487-93. doi: 10.1016/j.cub.2012.05.057. Epub 2012 Jun 28. Curr Biol. 2012. PMID: 22748319 Free PMC article. - Dysregulation of the endoplasmic reticulum blocks recruitment of centrosome-associated proteins resulting in mitotic failure.
Rollins KR, Blankenship JT. Rollins KR, et al. Development. 2023 Nov 15;150(22):dev201917. doi: 10.1242/dev.201917. Epub 2023 Nov 17. Development. 2023. PMID: 37971218 Free PMC article. - Compartmentalization of the endoplasmic reticulum in the early C. elegans embryos.
Lee ZY, Prouteau M, Gotta M, Barral Y. Lee ZY, et al. J Cell Biol. 2016 Sep 12;214(6):665-76. doi: 10.1083/jcb.201601047. Epub 2016 Sep 5. J Cell Biol. 2016. PMID: 27597753 Free PMC article. - Role for phosphatidylinositol in nuclear envelope formation.
Larijani B, Barona TM, Poccia DL. Larijani B, et al. Biochem J. 2001 Jun 1;356(Pt 2):495-501. doi: 10.1042/0264-6021:3560495. Biochem J. 2001. PMID: 11368777 Free PMC article. - Proper symmetric and asymmetric endoplasmic reticulum partitioning requires astral microtubules.
Smyth JT, Schoborg TA, Bergman ZJ, Riggs B, Rusan NM. Smyth JT, et al. Open Biol. 2015 Aug;5(8):150067. doi: 10.1098/rsob.150067. Open Biol. 2015. PMID: 26289801 Free PMC article.
References
- Acharya U, Mallabiabarrena A, Acharya JK, Malhotra V. Signaling via mitogen-activated protein kinase kinase (MEK1) is required for Golgi fragmentation during mitosis. Cell. 1998;92:183–192. - PubMed
- Alberts B, Bray D, Lewis J, Raff M, Roberts K, Watson JD. Molecular Biology of the Cell. 3rd ed. New York: Garland Publishing; 1994.
- Berlin RD, Oliver JM, Water RF. Surface functions during mitosis 1: phagocytosis, pinocytosis and mobility of surface-bound ConA. Cell. 1978;15:327–341. - PubMed
Publication types
MeSH terms
Substances
LinkOut - more resources
Full Text Sources
Other Literature Sources
Miscellaneous

