Antigen-specific B cell memory: expression and replenishment of a novel b220(-) memory b cell compartment - PubMed (original) (raw)
Antigen-specific B cell memory: expression and replenishment of a novel b220(-) memory b cell compartment
L J McHeyzer-Williams et al. J Exp Med. 2000.
Abstract
The mechanisms that regulate B cell memory and the rapid recall response to antigen remain poorly defined. This study focuses on the rapid expression of B cell memory upon antigen recall in vivo, and the replenishment of quiescent B cell memory that follows. Based on expression of CD138 and B220, we reveal a unique and major subtype of antigen-specific memory B cells (B220(-)CD138(-)) that are distinct from antibody-secreting B cells (B220(+/)-CD138(+)) and B220(+)CD138(-) memory B cells. These nonsecreting somatically mutated B220(-) memory responders rapidly dominate the splenic response and comprise >95% of antigen-specific memory B cells that migrate to the bone marrow. By day 42 after recall, the predominant quiescent memory B cell population in the spleen (75-85%) and the bone marrow (>95%) expresses the B220(-) phenotype. Upon adoptive transfer, B220(-) memory B cells proliferate to a lesser degree but produce greater amounts of antibody than their B220(+) counterparts. The pattern of cellular differentiation after transfer indicates that B220(-) memory B cells act as stable self-replenishing intermediates that arise from B220(+) memory B cells and produce antibody-secreting cells on rechallenge with antigen. Cell surface phenotype and Ig isotype expression divide the B220(-) compartment into two main subsets with distinct patterns of integrin and coreceptor expression. Thus, we identify new cellular components of B cell memory and propose a model for long-term protective immunity that is regulated by a complex balance of committed memory B cells with subspecialized immune function.
Figures
Figure 1
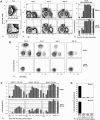
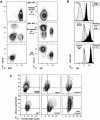
Three major subsets of NP-specific memory B cells. Previously primed C57BL/6 mice, rechallenged with 400 μg NP-KLH in Ribi adjuvant, were killed at various times after recall to label spleen and bone marrow cells for five-color flow cytometry. (A, i and ii) PI labeling is excluded at time of acquisition. One example of light scatter parameters and Cy5PE labeling (anti-CD4, anti-CD8, and anti-F4/80) used to exclude T cells, macrophage, and cells that nonspecifically label with Abs. Light scatter gates are broad to include B cell blasts. (A iii) Examples of IgD (Texas red 11.26) and NP (NP-APC) labeling on the Cy5PE− cells. Days after recall are displayed above each pair of panels. The top panels are spleen, and the lower are bone marrow. Each upper left quadrant delineates fluorescence intensities of cells regarded as NP+IgD−. (A iv) Cellular dynamics of the total NP-binding B cell compartment. Frequencies of NP-binding IgD− B cells obtained by flow cytometry, and total cell numbers from the spleen (top) and bone marrow (bottom) of each animal at the time of killing were used to estimate the change in total NP-binding cells during the course of the recall response. Varying numbers of single animals were used for each time point (n = 3–7), with mean ± SEM of total cells displayed. (B) Examples of CD138 (PE-281.2) and B220 (FITC–RA3-6B2) levels on NP-specific B cells (CD4−CD8−F4/80−IgD−NP+) of the spleen (top) and bone marrow (bottom). The day after Ag administration is displayed above each panel. (C) Cellular dynamics of the three NP-binding B cell subsets, with the phenotype displayed above each panel for the spleen (top) and bone marrow (bottom). Mean ± SEM of total cells is displayed across time after recall (n = 3–7 for each time point). (D) CD4,− CD8,− and F4/80− NP+IgD− B cells with the phenotype B220+/−CD138+, B220+CD138−, and B220−CD138− B cells from the spleen and bone marrow (BM) of the secondary response were sorted at 50 cells per well into NP-specific IgG-revealing ELISPOT assays. Positives were scored manually under a dissection microscope. Each assay was done in triplicate from at least three separate animals.
Figure 2
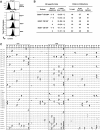
All three NP-specific subsets express somatically mutated Vλ1 L chains. (A) Representative histograms of λ1 L chain expression (FITC-JC5) on CD4−, CD8−, and F4/80− cells that were also NP−IgD+B220+ (first panel), NP+IgD−B220+/− (second panel), NP+IgD−B220+ (third panel), and NP+ IgD−B220− (fourth panel). (B) A summary of the extent and pattern of somatic hypermutation in the λ1 L chain expressed by the three major subsets of NP-specific B cells (PI−CD4− CD8−F4/80−NP+IgD−). Single NP-specific B cells from each of the three subpopulations of cells (as defined in the legend to Fig. 1) at different time points of the recall response were sorted into cDNA reaction mix, subjected to two separate rounds of PCR for λ L chain and PCR products, sequenced as described in Materials and Methods. Day of response refers to time after rechallenge; # cells refers to the number of λ L chains sequenced from individual cells and the proportion that were mutated versus nonmutated; % total represents the percentage of the total base pairs sequenced that were mutated (reliable sequence from position 26–88 for all samples), with the average number of mutations per mutated sequence summarized in the next column; and the % replacement mutations in the CDR1 and 2 are presented in the final column. (C) A representative set of Vλ gene nucleotide and predicted amino acid sequence obtained from individual NP-specific B cells. Only the nucleotides differing from the germline V-J sequence are presented: dashes represent identity; CDR 1 and 2 are boxed. The cells are grouped into four categories, with each representing sequence from individual cells with the phenotype of the following: the upper panel is NP+IgD− B220+/−CD138+ B cells (labeled B+/−) from days 3 and 5; the second panel is NP+IgD−B220+CD138− B cells (B+) from day 4; the third panel is NP+IgD−B220−CD138− B cells (B−) from the spleen or bone marrow (bm) from day 4 and 5; and the bottom panel is NP+IgD−B220−CD138− B cells (B−) from day 9 spleen.
Figure 3
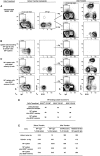
Adoptive transfer of purified quiescent B220+ and B220− memory B cells. (A) 4 × 10⁷ unfractionated spleen cells from animals 42 d after rechallenge were injected into the tail vein of Rag-1–deficient animals, with or without intraperitoneal injection of 50 μg NP-KLH (no adjuvant). The first panel represents the NP and IgD profiles of PI−, CD4−, CD8−, and F4/80− spleen cells before transfer (percentage of NP-specific cells in total spleen cells is indicated above the insert). The second panel represents the CD138 and B220 profiles of the NP-specific cells in these animals. The third panel represents the NP and IgD profiles of the PI−, CD4−, CD8−, and F4/80− spleen cells from Rag-1–deficient mice 5 d after transfer. The fourth panel represents the CD138 and B220 profiles of these NP-specific cells (+ or − Ag as labeled). (B) The first two panels present reanalysis of spleen cells from day 42 memory mice, excluding NP+IgD− and all CD138+ cells at the time of sorting. 5–8 × 10⁶ spleen cells sorted this way (NP− spleen) were injected into the tail vein (with Ag intraperitoneally as above), and spleen cells from Rag-1–deficient recipients analyzed 5 d after transfer (third and fourth panel). (C) 2–6 × 10⁴ purified NP+IgD−CD138− that were either B220+ (>95% purified; top) or B220− (>99% purified; bottom) were added to 5–8 × 10⁶ NP− spleen cells before adoptive transfer. The first two panels in each set display reanalysis of cell populations to be transferred after addition of the purified memory subset. The third panel displays (PI−, CD4−, CD8−, and F4/80− NP and IgD cells in Rag-1–deficient recipients 5 d after transfer, with the frequency of NP+IgD− cells in the total spleen indicated above inset. The last panel displays CD138 and B220 profiles for NP+IgD− spleen cells in the Rag-1–deficient recipients 5 d after transfer. (D) Mean of two adoptive transfer experiments displaying the proportion of the three subsets recovered after transfer. The level of NP+ events after transfer of the NP− spleen cells alone was negligible, so they are not included in this table. (E) Summary of cell recovery and Ab production during time of transfer (n = 2 or 3 animals). Cell recovery was calculated as the percent of NP-specific cells recovered over the number transferred. N/A indicates not applicable, as the number of NP-specific cells transferred and recovered was negligible. The relative titer of NP-specific Ab is displayed as the titer of serum that produced an OD of 1.4 OD units (maximum of 4.0 OD units).
Figure 4
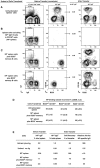
Adoptive transfer of purified emergent B220+ and B220− memory B cells. (A) 4 × 10⁷ unfractionated spleen cells from animals 4 d after rechallenge were injected into the tail vein of C57BL/6 Rag-1–deficient animals by intraperitoneal injection with 50 μg NP-KLH (no adjuvant). The first panel represents the NP and IgD profiles of the spleen cells that were transferred. The second panel represents the CD138 and B220 profiles of the NP+IgD− cells in these animals (percentage of NP-specific cells in total spleen cells before transfer is indicated above inset). The percentage of NP+IgD− cells after transfer (of total spleen cells in recipient) is displayed in the next column, and the third panel represents the CD138 and B220 profiles of the NP+IgD− cells in the spleens of the Rag-1–deficient mice 5 d after transfer. (B) The first two panels present reanalysis of spleen cells from day 4 memory mice, excluding NP+IgD− and all CD138+ cells at the time of sorting. 5–8 × 10⁶ spleen cells sorted this way (NP− spleen) were injected into the tail vein (with Ag intraperitoneally as above), and spleen cells from Rag-1–deficient donors analyzed 5 d after transfer (third panel). (C) 2–6 × 10⁴ purified NP+IgD−CD138− that were B220+ (top) or B220− bottom) were added to 5–8 × 10⁶ NP− spleen cells before adoptive transfer. The first two panels in each set are the reanalysis of the cell mixture immediately before transfer, and in the last panel are the CD138 and B220 profiles of the NP+IgD−spleen cells in the Rag-1–deficient recipients 5 d after transfer. (D) Mean ± SEM from three adoptive transfer experiments displaying the proportion of the three subsets recovered after transfer. The level of NP+ events after transfer of the NP− spleen cells alone was negligible, so they are not included in this table. (E) Summary of cell recovery and Ab production during time of transfer (n = 2 or 3 animals). Cell recovery was calculated as the percent of NP-specific cells recovered divided by the number transferred. N/A indicates not applicable, as the number of NP-specific cells transferred and recovered was negligible. The relative titer of NP-specific Ab is displayed as the titer of serum that produced an OD of 1.4 OD units (maximum of 4.0 OD units).
Figure 5
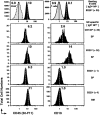
B220−CD138− memory B cells express an alternate form of CD45 and no CD19. Representative histograms for CD45 (FITC–30-F11) and CD19 (FITC-1D3) on CD4−, CD8−, and F4/80− cells that were also IgD+NP−B220+ B cells (first row), IgD−NP+CD138+ (second row), IgD−NP+B220+ (third row), and IgD−NP+B220− cells from the spleen (fourth row) and bone marrow (fifth row). Where pertinent, levels of labeling for “T cells” (the majority of Cy5-PE+ are CD4 and CD8 T cells), CD45−IgD−NP−B220− cells are also displayed in the first row. All displays are from the same animal at day 9 of the recall response and are representative of three to eight animals. The dashed lines within each histogram and the number associated depict the geometric mean fluorescence for the reagent presented.
Figure 6
Two major subsets of NP-specific B220− memory B cells. (A) Representative profiles of CD138 and B220 (first column) and CD11b and IgE (second column) on CD4−, CD8−, and F4/80− cells that were also NP−IgD+ (first row), NP+IgD− spleen (second row), and NP+IgD− bone marrow (third row). (B) Histograms for anti-IgG labeling on total CD11b++NP−IgD− (top, black), small forward/side scatter Cy5PE+ cells (mostly T cells; top, gray), NP−IgD+B220+ (resting B cells; middle, gray), NP+IgD−CD11b− (NP-specific B220+/− and B220+; middle, black), NP+IgD−CD11b++ (bottom, black), and NP+IgD−CD11b+IgE+ (bottom, gray). Cells were labeled with PE–anti-IgG, blocked with normal mouse serum, and then labeled with mAbs as described. (C) Representative profiles for forward and obtuse light scatter on CD4−, CD8−, and F4/80− cells that were also NP−IgD+ B220+ (resting B cells; top left), NP+ IgD−CD138−B220+ (B220+; top middle), NP+IgD−CD11b++IgE− (CD11b++; top right), NP+IgD−CD11b+IgE+ (IgE+; bottom left), NP+IgD−CD138+B220+/− (CD138+; bottom middle), and CD11b++ NP−IgD− (total CD11b++; bottom right). (A–C) Profiles are from day 9 of the recall response and are representative of three to nine animals. (D) TEM of CD4−, CD8−, and F4/80− NP+IgD−CD11b++IgE− spleen cells from day 9 recall response. 1.2 × 10⁵ cells were sorted into 2% glutaraldehyde and processed for TEM by Duke Comprehensive Cancer Facility. Images are representative of at least 100 individual CD11b++ NP-specific cells scanned.
Figure 7
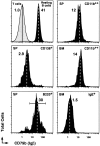
CD79b expression on NP-specific memory B cells. Representative histograms for CD79b on spleen CD4−, CD8−, and F4/80− cells that were also NP−IgD+B220+ B cells (first column, top), IgD−NP+CD138+ (first column, middle), IgD−NP+B220+ (first column, bottom), IgD−NP+CD11b++ (second column, top), bone marrow IgD−NP+CD11b++ (second column, middle), and IgD−NP+IgE− (second column, bottom). Levels of labeling for T cells (small forward/side scatter, Cy5-PE+ cells) are also displayed in the first column, top. All displays are from day 9 recall response and are representative of eight animals. The dashed lines within each histogram and the number associated depict the geometric mean fluorescence intensity for CD79b.
Similar articles
- Development and maintenance of a B220- memory B cell compartment.
Driver DJ, McHeyzer-Williams LJ, Cool M, Stetson DB, McHeyzer-Williams MG. Driver DJ, et al. J Immunol. 2001 Aug 1;167(3):1393-405. doi: 10.4049/jimmunol.167.3.1393. J Immunol. 2001. PMID: 11466358 - Correlation of tissue distribution, developmental phenotype, and intestinal homing receptor expression of antigen-specific B cells during the murine anti-rotavirus immune response.
Youngman KR, Franco MA, Kuklin NA, Rott LS, Butcher EC, Greenberg HB. Youngman KR, et al. J Immunol. 2002 Mar 1;168(5):2173-81. doi: 10.4049/jimmunol.168.5.2173. J Immunol. 2002. PMID: 11859103 - Characterization of the spleen B-cell compartment at the early and late blood-stage Plasmodium chabaudi malaria.
Castillo-Méndez SI, Zago CA, Sardinha LR, Freitas do Rosário AP, Alvarez JM, D'Império Lima MR. Castillo-Méndez SI, et al. Scand J Immunol. 2007 Aug-Sep;66(2-3):309-19. doi: 10.1111/j.1365-3083.2007.01972.x. Scand J Immunol. 2007. PMID: 17635808 - Characteristics and development of the murine B-1b (Ly-1 B sister) cell population.
Stall AM, Adams S, Herzenberg LA, Kantor AB. Stall AM, et al. Ann N Y Acad Sci. 1992 May 4;651:33-43. doi: 10.1111/j.1749-6632.1992.tb24591.x. Ann N Y Acad Sci. 1992. PMID: 1376053 Review. - Study of murine B-cell development through analysis of immunoglobulin variable region genes.
Gu H, Förster I, Rajewsky K. Gu H, et al. Ann N Y Acad Sci. 1992 May 4;651:304-10. doi: 10.1111/j.1749-6632.1992.tb24628.x. Ann N Y Acad Sci. 1992. PMID: 1534647 Review. No abstract available.
Cited by
- Antigen-specific T helper cell function: differential cytokine expression in primary and memory responses.
Panus JF, McHeyzer-Williams LJ, McHeyzer-Williams MG. Panus JF, et al. J Exp Med. 2000 Nov 6;192(9):1301-16. doi: 10.1084/jem.192.9.1301. J Exp Med. 2000. PMID: 11067879 Free PMC article. - Transcriptional analysis of the B cell germinal center reaction.
Klein U, Tu Y, Stolovitzky GA, Keller JL, Haddad J Jr, Miljkovic V, Cattoretti G, Califano A, Dalla-Favera R. Klein U, et al. Proc Natl Acad Sci U S A. 2003 Mar 4;100(5):2639-44. doi: 10.1073/pnas.0437996100. Epub 2003 Feb 25. Proc Natl Acad Sci U S A. 2003. PMID: 12604779 Free PMC article. - Antigen-specific B cell detection reagents: use and quality control.
Moody MA, Haynes BF. Moody MA, et al. Cytometry A. 2008 Nov;73(11):1086-92. doi: 10.1002/cyto.a.20599. Cytometry A. 2008. PMID: 18613115 Free PMC article. Review. - Increased IL-12 inhibits B cells' differentiation to germinal center cells and promotes differentiation to short-lived plasmablasts.
Kim SJ, Caton M, Wang C, Khalil M, Zhou ZJ, Hardin J, Diamond B. Kim SJ, et al. J Exp Med. 2008 Sep 29;205(10):2437-48. doi: 10.1084/jem.20070731. Epub 2008 Sep 22. J Exp Med. 2008. PMID: 18809711 Free PMC article. - Decreased expression of Kruppel-like factors in memory B cells induces the rapid response typical of secondary antibody responses.
Good KL, Tangye SG. Good KL, et al. Proc Natl Acad Sci U S A. 2007 Aug 14;104(33):13420-5. doi: 10.1073/pnas.0703872104. Epub 2007 Aug 2. Proc Natl Acad Sci U S A. 2007. PMID: 17673551 Free PMC article.
References
- Eisen H.N., Siskind G.W. Variations in the affinity of antibodies during an immune response. Biochemistry. 1969;3:996–1008. - PubMed
- Siskind G.W., Benacerraf B. Cell selection by antigen in the immune response. Adv. Immunol. 1969;10:1–50. - PubMed
- Coico R.F., Bhogal B.S., Thorbecke G.J. Relationship of germinal centers in lymphoid tissue to immunologic memory. VI. Transfer of B cell memory with lymph node cells fractionated according to their receptors for peanut agglutinin. J. Immunol. 1983;131:2254–2257. - PubMed
- McHeyzer-Williams M.G., Ahmed R. B cell memory and the long-lived plasma cell. Curr. Opin. Immunol. 1999;11:172–179. - PubMed
- MacLennan I.C.M., Gray D. Antigen-driven selection of virgin and memory B cells. Immunol. Rev. 1986;91:61–85. - PubMed
Publication types
MeSH terms
Substances
LinkOut - more resources
Full Text Sources
Other Literature Sources
Research Materials
