Methylation of the cyclin A1 promoter correlates with gene silencing in somatic cell lines, while tissue-specific expression of cyclin A1 is methylation independent - PubMed (original) (raw)
Methylation of the cyclin A1 promoter correlates with gene silencing in somatic cell lines, while tissue-specific expression of cyclin A1 is methylation independent
C Müller et al. Mol Cell Biol. 2000 May.
Abstract
Gene expression in mammalian organisms is regulated at multiple levels, including DNA accessibility for transcription factors and chromatin structure. Methylation of CpG dinucleotides is thought to be involved in imprinting and in the pathogenesis of cancer. However, the relevance of methylation for directing tissue-specific gene expression is highly controversial. The cyclin A1 gene is expressed in very few tissues, with high levels restricted to spermatogenesis and leukemic blasts. Here, we show that methylation of the CpG island of the human cyclin A1 promoter was correlated with nonexpression in cell lines, and the methyl-CpG binding protein MeCP2 suppressed transcription from the methylated cyclin A1 promoter. Repression could be relieved by trichostatin A. Silencing of a cyclin A1 promoter-enhanced green fluorescent protein (EGFP) transgene in stable transfected MG63 osteosarcoma cells was also closely associated with de novo promoter methylation. Cyclin A1 could be strongly induced in nonexpressing cell lines by trichostatin A but not by 5-aza-cytidine. The cyclin A1 promoter-EGFP construct directed tissue-specific expression in male germ cells of transgenic mice. Expression in the testes of these mice was independent of promoter methylation, and even strong promoter methylation did not suppress promoter activity. MeCP2 expression was notably absent in EGFP-expressing cells. Transcription from the transgenic cyclin A1 promoter was repressed in most organs outside the testis, even when the promoter was not methylated. These data show the association of methylation with silencing of the cyclin A1 gene in cancer cell lines. However, appropriate tissue-specific repression of the cyclin A1 promoter occurs independently of CpG methylation.
Figures
FIG. 1
Methylation of the CpG island in the cyclin A1 promoter correlates with loss of expression in somatic cell lines. (a) Distribution of CpG dinucleotides in the cyclin A1 gene, bp −1299 to +633. The CpG island of the cyclin A1 promoter extends over 1,200 bp and includes four critically important Sp1 binding sites (marked Sp1). The main transcriptional start site and the area analyzed by bisulfite sequencing are also indicated. (b) Bisulfite sequencing was carried out according to the method described by Clark et al. (8) with minor modifications (see Materials and Methods). Shown are the sequencing results for unmodified DNA (U937) and for bisulfite-treated DNA from a cyclin A1-expressing (U937) and a nonexpressing (HeLa) cell line. The methylated CpG dinucleotides (mCpG) are indicated in HeLa cells in the area surrounding the two most proximal Sp1 sites of the cyclin A1 promoter. (c) A total of 27 CpG dinucleotides (14 to 18 independent clones) were analyzed for methylation in each of the four cell lines, which differ in their levels of cyclin A1 expression. The percentage of methylation at each CpG is indicated. The last CpG, at +117, is outside the CpG island and was found to be completely methylated in all of the cell lines. The order of the degree of cyclin A1 expression in these cell lines is U937>KCL22>PC3>HeLa, and cyclin A1 expression in PC3 and HeLa is not detectable by Northern blot analysis (43).
FIG. 2
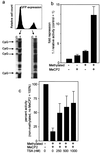
Methylation is associated with silencing of a cyclin A1 promoter-EGFP transgene in MG63 cells, and MeCP2 represses the methylated cyclin A1 promoter by an HDAC-dependent mechanism. (a) MG63 osteosarcoma cells were stably transfected with a cyclin A1 promoter-EGFP construct. After 2 months of continuous culture, a fraction of neomycin-resistant cells had lost expression of EGFP. Both populations were sorted by flow cytometry and analyzed for CpG methylation of the cyclin A1 promoter transgene. Specific primers were designed for the promoter-EGFP construct to avoid analysis of the endogenous cyclin A1 locus. Strong methylation was observed in nonexpressing cells, whereas negligible or very low levels of methylation were observed in expressing cells. (b) Methylated (+) or mock-methylated (−) reporter constructs were transfected into S2 Drosophila cells along with an Sp1 expression plasmid and either an empty vector (−) or an MeCP2 expression vector (+). Fold repression was calculated as 1/relative activity, with the activity of the control set as 1. The results are shown as the mean + SE of three independent experiments. (c) TSA relieves MeCP2-mediated repression of the methylated cyclin A1. Twenty-four hours after transfection of the methylated construct and the MeCP2 expression vector, TSA was added in different concentrations as indicated. The next day, luciferase activities were analyzed.
FIG. 3
mRNA expression levels of MBD protein family members in human cancer cell lines. Expression levels of the indicated MBD family members were determined by quantitative real-time PCR as described in Materials and Methods. The indicated relative gene expression shows expression levels that were standardized using expression of GAPDH as a standard. Expression levels were determined independently at least three times and are shown as the mean + SE.
FIG. 4
Inhibitors of histone deacetylases alter the phenotypes of HeLa cells. HeLa cells were exposed to 5-aza-C for 96 h and to TSA for 24 h. Exposure of cells to 5-aza-C (c) did not induce morphological changes compared to control cells (a). TSA alone (b) or in combination with 5-aza-C (d) led to cell death and signs of differentiation, such as spindle cell formation.
FIG. 5
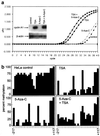
(a) Induction of endogenous cyclin A1 expression by TSA. Induction of cyclin A1 gene expression by 5-aza-C and TSA was analyzed by quantitative real-time PCR as well as by conventional RT-PCR followed by hybridization. The plot for the amplification of cyclin A1 cDNA from HeLa cells that were exposed to the indicated drugs is shown. The x axis shows the cycle number, and the y axis shows the changes in fluorescence compared to baseline values. These samples contained similar amounts of cDNA, as demonstrated by analysis of GAPDH expression (not shown). The inset shows conventional RT-PCR for cyclin A1 (28 cycles) and β-actin (20 cycles). PCR was followed by Southern blotting and nonradioactive detection with an internal oligonucleotide. TSA, but not 5-aza-C, led to a strong induction of cyclin A1 in HeLa cells. (b) 5-aza-C and TSA lead to demethylation of the cyclin A1 promoter in HeLa cells. To analyze the effects of 5-aza-C and TSA on the methylation status of the endogenous cyclin A1 promoter in HeLa cells, genomic DNA was prepared, bisulfite treated, PCR amplified, and sequenced (see Materials and Methods). The percentage of methylation at 27 CpG dinucleotides of the cyclin A1 promoter is indicated. Two independent DNA preparations and PCR amplifications were performed and cloned, and at least 10 independent clones were sequenced.
FIG. 6
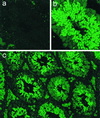
Testis-specific expression of the cyclin A1 promoter in transgenic mice. Transgenic mouse lines were established using the cyclin A1 promoter-EGFP reporter plasmid described in the legend to Fig. 2. Frozen sections from testes of adult mice were cut, rinsed in phosphate-buffered saline for 10 min, and analyzed by confocal laser scanning microscopy. (a) No fluorescence was observed in testicular tubuli of control mice. (b and c) In contrast, strong and highly specific expression of EGFP was detected in the testes of the transgenic mice. Maximal EGFP expression was observed during and after the first meiotic division, and a weaker staining was present in spermatogonia. The fluorescence of the interstitial Leydig cells in panel c is unrelated to EGFP expression but depends on the accumulation of lipids. The wavelength of the emitted light is different from that of EGFP. Magnifications are ×380 (a and b) and ×95 (c).
FIG. 7
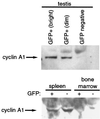
EGFP expression in testes but not in somatic cells of transgenic mice correlates with endogenous cyclin A1 expression. Testis, spleen, and bone marrow cells from transgenic animals were sorted by flow cytometry into expressing (+) and nonexpressing (−) populations. Testis cells were further divided into highly (bright) and weakly (dim) expressing populations. A total of 2 × 10⁵ cells of each population were lysed in sodium dodecyl sulfate sample buffer, and samples were run on a 10% Tris-HCl gel. The blots were probed with anti-cyclin A1 rabbit polyclonal antibody as described previously (52). The strong background seen for the spleen and bone marrow cells relates to the much longer exposure necessary to visualize the bands. Results similar to those for the spleen and bone marrow cells were obtained for EGFP-expressing kidney cells.
FIG. 8
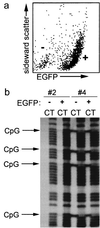
Expression of EGFP in germ cells of transgenic mice is independent of methylation of the transgenic cyclin A1 promoter. (a) To analyze whether the CpG methylation status differed in EGFP-expressing and non-EGFP-expressing cells in the testis, the testes of two murine lines (no. 2 and 4) were enzymatically disaggregated and sorted by flow cytometry in expressing (+) and nonexpressing (−) cells. Shown is a representative flow cytometry analysis of testicular cells from murine line no. 2. (b) Genomic DNA of the sorted testicular cells was analyzed for CpG methylation. In murine line no. 2, CpG methylation was not seen in EGFP-expressing (+) or non-EGFP-expressing testicular cells (−). In murine line no. 4, EGFP-expressing cells were completely methylated at all CpG dinucleotides. The methylation status did not differ in EGFP-expressing (+) and non-EGFP-expressing (−) testicular cells.
FIG. 9
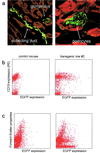
Aberrant expression of EGFP was found in kidneys and B lymphocytes from transgenic murine line no. 2. (a) Expression of EGFP in kidneys of murine line no. 2 is tightly restricted to podocytes in glomeruli and to collecting ducts. Nonfluorescent structures detected by phase-contrast microscopy were colored red to allow a better visualization of the overall structure of the kidney. (b) B lymphocytes from the spleen of a transgenic mouse (line no. 2) and from a negative-control mouse were stained using anti-CD19 monoclonal antibody labeled with phycoerythrin (PE). About 40% of the B cells of murine line no. 2 expressed EGFP. Note that the population that does not express CD19 also does not express EGFP. (c) Bone marrow from a control mouse and a mouse of line no. 2 were analyzed by flow cytometry without antibody staining. The forward scatter properties distinguish cell populations according to their sizes. The very small percentage of hematopoietic stem cells (<1%) precludes us from determining whether EGFP expression in these cells reflects the endogenous cyclin A1.
FIG. 10
Expression levels of MBD family members in murine tissues. The mRNA levels of murine MBD proteins were determined by quantitative real-time RT-PCR as described in Material and Methods. EGFP-expressing (GFP+) and non-EGFP-expressing (GFP−) testicular cells from transgenic mice were sorted by flow cytometry before the preparation of RNA. MeCP2 expression was very low in EGFP-expressing male germ cells. On the other hand, MeCP2 was robustly expressed in EGFP-negative testis cells from the same mice. Expression levels of MBD-1 to MBD-4 and the testis-specific variant of MBD-2 showed only minor differences in expression between the two testicular cell populations. The error bars represent the SE.
Similar articles
- Altered chromatin structure associated with methylation-induced gene silencing in cancer cells: correlation of accessibility, methylation, MeCP2 binding and acetylation.
Nguyen CT, Gonzales FA, Jones PA. Nguyen CT, et al. Nucleic Acids Res. 2001 Nov 15;29(22):4598-606. doi: 10.1093/nar/29.22.4598. Nucleic Acids Res. 2001. PMID: 11713309 Free PMC article. - Analyses of the genomic methylation status of the human cyclin A1 promoter by a novel real-time PCR-based methodology.
Müller-Tidow C, Bornemann C, Diederichs S, Westermann A, Klümpen S, Zuo P, Wang W, Berdel WE, Serve H. Müller-Tidow C, et al. FEBS Lett. 2001 Feb 9;490(1-2):75-8. doi: 10.1016/s0014-5793(01)02128-7. FEBS Lett. 2001. PMID: 11172814 - Heterogeneity in the modification and involvement of chromatin components of the CpG island of the silenced human CDH1 gene in cancer cells.
Koizume S, Tachibana K, Sekiya T, Hirohashi S, Shiraishi M. Koizume S, et al. Nucleic Acids Res. 2002 Nov 1;30(21):4770-80. doi: 10.1093/nar/gkf593. Nucleic Acids Res. 2002. PMID: 12409468 Free PMC article. - Gene silencing by methyl-CpG-binding proteins.
Nan X, Cross S, Bird A. Nan X, et al. Novartis Found Symp. 1998;214:6-16; discussion 16-21, 46-50. doi: 10.1002/9780470515501.ch2. Novartis Found Symp. 1998. PMID: 9601009 Review. - Methyl-CpG-binding proteins. Targeting specific gene repression.
Ballestar E, Wolffe AP. Ballestar E, et al. Eur J Biochem. 2001 Jan;268(1):1-6. doi: 10.1046/j.1432-1327.2001.01869.x. Eur J Biochem. 2001. PMID: 11121095 Review.
Cited by
- Methyl-CpG-binding protein 2 represses LINE-1 expression and retrotransposition but not Alu transcription.
Yu F, Zingler N, Schumann G, Strätling WH. Yu F, et al. Nucleic Acids Res. 2001 Nov 1;29(21):4493-501. doi: 10.1093/nar/29.21.4493. Nucleic Acids Res. 2001. PMID: 11691937 Free PMC article. - Cyclin A1 is a transcriptional target of PITX2 and overexpressed in papillary thyroid carcinoma.
Liu Y, Huang Y, Zhu GZ. Liu Y, et al. Mol Cell Biochem. 2013 Dec;384(1-2):221-7. doi: 10.1007/s11010-013-1801-9. Epub 2013 Sep 4. Mol Cell Biochem. 2013. PMID: 24002705 - Evolving role of MeCP2 in Rett syndrome and autism.
LaSalle JM, Yasui DH. LaSalle JM, et al. Epigenomics. 2009 Oct;1(1):119-30. doi: 10.2217/epi.09.13. Epigenomics. 2009. PMID: 20473347 Free PMC article. Review. - Methylation-dependent and independent regulatory regions in the Na,K-ATPase alpha4 (Atp1a4) gene may impact its testis-specific expression.
Kumar DL, Kumar PL, James PF. Kumar DL, et al. Gene. 2016 Jan 10;575(2 Pt 1):339-52. doi: 10.1016/j.gene.2015.09.003. Epub 2015 Sep 4. Gene. 2016. PMID: 26343794 Free PMC article. - The cyclin A1-CDK2 complex regulates DNA double-strand break repair.
Müller-Tidow C, Ji P, Diederichs S, Potratz J, Bäumer N, Köhler G, Cauvet T, Choudary C, van der Meer T, Chan WY, Nieduszynski C, Colledge WH, Carrington M, Koeffler HP, Restle A, Wiesmüller L, Sobczak-Thépot J, Berdel WE, Serve H. Müller-Tidow C, et al. Mol Cell Biol. 2004 Oct;24(20):8917-28. doi: 10.1128/MCB.24.20.8917-8928.2004. Mol Cell Biol. 2004. PMID: 15456866 Free PMC article.
References
- Antequera F, Boyes J, Bird A. High levels of de novo methylation and altered chromatin structure at CpG islands in cell lines. Cell. 1990;62:503–514. - PubMed
- Bender C M, Pao M M, Jones P A. Inhibition of DNA methylation by 5-aza-2′-deoxycytidine suppresses the growth of human tumor cell lines. Cancer Res. 1998;58:95–101. - PubMed
- Boyes J, Bird A. DNA methylation inhibits transcription indirectly via a methyl-CpG binding protein. Cell. 1991;64:1123–1134. - PubMed
- Brandels M, Frank D, Keshet I, Siegfried Z, Mendelsohn M, Nemes A, Temper V, Razin A, Cedar H. Sp1 elements protect a CpG island from de novo methylation. Nature. 1994;371:435–438. - PubMed
Publication types
MeSH terms
Substances
LinkOut - more resources
Full Text Sources
Other Literature Sources

