Dynamics of DNA replication factories in living cells - PubMed (original) (raw)
Dynamics of DNA replication factories in living cells
H Leonhardt et al. J Cell Biol. 2000.
Abstract
DNA replication occurs in microscopically visible complexes at discrete sites (replication foci) in the nucleus. These foci consist of DNA associated with replication machineries, i.e., large protein complexes involved in DNA replication. To study the dynamics of these nuclear replication foci in living cells, we fused proliferating cell nuclear antigen (PCNA), a central component of the replication machinery, with the green fluorescent protein (GFP). Imaging of stable cell lines expressing low levels of GFP-PCNA showed that replication foci are heterogeneous in size and lifetime. Time-lapse studies revealed that replication foci clearly differ from nuclear speckles and coiled bodies as they neither show directional movements, nor do they seem to merge or divide. These four dimensional analyses suggested that replication factories are stably anchored in the nucleus and that changes in the pattern occur through gradual, coordinated, but asynchronous, assembly and disassembly throughout S phase.
Figures
Figure 5
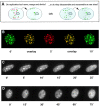
Larger replication foci are composed of independent smaller foci. One late S phase nucleus of a stably transfected cell was imaged over 2 h. Together with small size foci (less than 1-μm diam) several large foci are visible at the beginning of the experiment (left side nucleus). 2 h later some new small foci have formed and the large ones did not change their nuclear position, but decreased in size concomitantly with an increase in the disperse nucleoplasmic GFP–PCNAL2 protein (right side nucleus). Deconvolved images from different Z planes (middle) reveal that these large foci are made of clusters of small size foci which form and disassemble independently giving rise to the different shapes and sizes of the large foci over time. The signal (within the white box) seen in the undeconvolved whole nucleus after 2 h (right image) comes from out-of-focus light from the planes above. Bar, 1.5 μm.
Figure 1
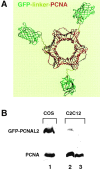
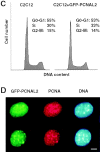
Construction of mammalian cell lines expressing GFP-tagged PCNA. A, The putative structure of the GFP-linker–PCNA fusion protein was assembled using published crystal structure information for GFP and PCNA (Gulbis et al. 1996; Ormö et al. 1996). The linker structure is a putative 18 residue polypeptide chain. B, Expression of the GFP–PCNAL2 fusion protein and the endogenous PCNA protein was monitored by Western blot analysis with an mAb against PCNA. Extracts from transiently transfected COS7 cells (lane 1), from one stably transfected C2C12 cell line (lane 2) and from untransfected C2C12 cells (lane 3) were compared. In lanes 2 and 3, extracts from half a million cells were loaded. C, Cell cycle distribution of an asynchronously growing population of C2C12+GFP–PCNAL2 stable cell line was compared with the untransfected parental C2C12 cells by FACS analysis of the DNA content stained with propidium iodide. 100,000 events were collected for each sample and the data analyzed using the ModFit LT software (Becton Dickinson). D, The localization of the autofluorescent GFP–PCNAL2 fusion protein was compared with the endogenous PCNA in the stable cell lines. Notice that the mAb against PCNA also recognizes the fusion protein which, however, amounts to <5% of the endogenous PCNA pool (see lane 2 in B). DNA was stained with Hoechst 33258. Bar, 5 μm.
Figure 2
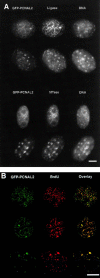
The GFP-tagged PCNA labels subnuclear DNA replication factories. A, The subcellular localization of the autofluorescent GFP–PCNAL2 fusion protein is shown in comparison with other known components of mammalian replication factories in two different typical S phase patterns. Stably transfected cells were stained with polyclonal antibodies against DNA ligase I (Ligase) and Dnmt1 (MTase). DNA was stained with Hoechst 33258. Bar, 5 μm. B, C2C12 cells were transfected with the GFP–PCNAL2 construct and 24 h later pulse-labeled with BrdU and fixed. Subnuclear sites of ongoing DNA replication were highlighted by staining with BrdU-specific antibodies (red). Four or five midplane confocal optical sections were stacked and overlays were made using Adobe Photoshop and MetaMorph programs. Yellow color shows the colocalization of the fusion protein (green) at replication foci. Bar, 10 μm.
Figure 3
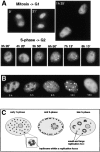
Changes in the distribution of replication factories throughout the cell cycle. Stably transfected cells (C2C12+GFP–PCNAL2) were grown in a live-cell microscopy chamber (FCS2 chamber, Bioptechs, Inc.) and monitored for up to 3 d. A, Selected images of a cell finishing mitosis and of one of the daughter cells followed until the next G2 phase are shown. B, A cell was imaged at higher resolution starting in early S phase with a fine punctate pattern of replication foci (time 0 h), succeeded by a perinucleolar pattern (at 5 h) and a characteristic late pattern with few, but large, foci (at 8–12 h). C, Typical early, mid, and late S phase patterns are schematically illustrated.
Figure 4
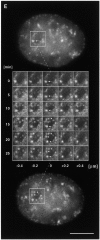
Dynamics of replication factories in living cells. A, Two possible models to explain the observed changes in the pattern of replication foci during S phase are schematically outlined. B, One S phase nucleus of a stably transfected cell was imaged in 5-min intervals shown in pseudocolors. The overlays of images taken at different time points were done using Adobe Photoshop software and show that replication foci do not change their relative nuclear positions. C and D, Two S phase nuclei were monitored over longer time periods showing replication foci disappearing and new ones appearing. Images in B–D are from three independent clonal cell lines. Changes due to movements/rotations of the cells were controlled for by collecting Z-stacks at each time point in all cases. E, A partial view of a 4D assembly showing in greater detail perinucleolar replication foci assembly (boxed area). One replication focus present throughout (arrow) and two replication foci gradually assembling (arrowheads) are highlighted. Bar, 5 μm.
Figure 6
4D analysis of replication factory assembly during S phase. A, Stably transfected cells were grown in a perfusion chamber and images were collected at high speed in different focal planes throughout the nucleus. Images were collected at 0.5-μm Z axis intervals and we show here every other section. B, Stacks of images, as shown in A, were collected in 10-min intervals. Changes occurring at two foci over a period of 90 min are shown at higher magnification. Notice the distance between these two foci remains constant, but the signal intensity changes over time. At the end of this time course, most GFP–PCNAL2-labeled foci disassembled and the corresponding protein is now dispersed throughout the nucleoplasm indicating the cell has entered G2 phase. C, The signal intensities above the nucleoplasmic GFP–PCNAL2 signal for the two foci shown in B were quantified and expressed as arbitrary units of integrated pixel intensities over time.
Similar articles
- High mobility of flap endonuclease 1 and DNA polymerase eta associated with replication foci in mammalian S-phase nucleus.
Solovjeva L, Svetlova M, Sasina L, Tanaka K, Saijo M, Nazarov I, Bradbury M, Tomilin N. Solovjeva L, et al. Mol Biol Cell. 2005 May;16(5):2518-28. doi: 10.1091/mbc.e04-12-1066. Epub 2005 Mar 9. Mol Biol Cell. 2005. PMID: 15758026 Free PMC article. - DNA polymerase clamp shows little turnover at established replication sites but sequential de novo assembly at adjacent origin clusters.
Sporbert A, Gahl A, Ankerhold R, Leonhardt H, Cardoso MC. Sporbert A, et al. Mol Cell. 2002 Dec;10(6):1355-65. doi: 10.1016/s1097-2765(02)00729-3. Mol Cell. 2002. PMID: 12504011 - Targeting of PCNA to sites of DNA replication in the mammalian cell nucleus.
Somanathan S, Suchyna TM, Siegel AJ, Berezney R. Somanathan S, et al. J Cell Biochem. 2001;81(1):56-67. doi: 10.1002/1097-4644(20010401)81:1<56::aid-jcb1023>3.0.co;2-#. J Cell Biochem. 2001. PMID: 11180397 - Intranuclear targeting of DNA replication factors.
Leonhardt H, Rahn HP, Cardoso MC. Leonhardt H, et al. J Cell Biochem Suppl. 1998;30-31:243-9. J Cell Biochem Suppl. 1998. PMID: 9893277 Review. - Review: the dynamics of the nuclear lamins during the cell cycle-- relationship between structure and function.
Moir RD, Spann TP, Lopez-Soler RI, Yoon M, Goldman AE, Khuon S, Goldman RD. Moir RD, et al. J Struct Biol. 2000 Apr;129(2-3):324-34. doi: 10.1006/jsbi.2000.4251. J Struct Biol. 2000. PMID: 10806083 Review.
Cited by
- FUCCI Real-Time Cell-Cycle Imaging as a Guide for Designing Improved Cancer Therapy: A Review of Innovative Strategies to Target Quiescent Chemo-Resistant Cancer Cells.
Yano S, Tazawa H, Kagawa S, Fujiwara T, Hoffman RM. Yano S, et al. Cancers (Basel). 2020 Sep 17;12(9):2655. doi: 10.3390/cancers12092655. Cancers (Basel). 2020. PMID: 32957652 Free PMC article. Review. - Principles and concepts of DNA replication in bacteria, archaea, and eukarya.
O'Donnell M, Langston L, Stillman B. O'Donnell M, et al. Cold Spring Harb Perspect Biol. 2013 Jul 1;5(7):a010108. doi: 10.1101/cshperspect.a010108. Cold Spring Harb Perspect Biol. 2013. PMID: 23818497 Free PMC article. Review. - Cell size homeostasis is tightly controlled throughout the cell cycle.
Liu X, Yan J, Kirschner MW. Liu X, et al. PLoS Biol. 2024 Jan 5;22(1):e3002453. doi: 10.1371/journal.pbio.3002453. eCollection 2024 Jan. PLoS Biol. 2024. PMID: 38180950 Free PMC article. - Replication fork velocities at adjacent replication origins are coordinately modified during DNA replication in human cells.
Conti C, Saccà B, Herrick J, Lalou C, Pommier Y, Bensimon A. Conti C, et al. Mol Biol Cell. 2007 Aug;18(8):3059-67. doi: 10.1091/mbc.e06-08-0689. Epub 2007 May 23. Mol Biol Cell. 2007. PMID: 17522385 Free PMC article. - Cell cycle regulation as a mechanism for functional separation of the apparently redundant uracil DNA glycosylases TDG and UNG2.
Hardeland U, Kunz C, Focke F, Szadkowski M, Schär P. Hardeland U, et al. Nucleic Acids Res. 2007;35(11):3859-67. doi: 10.1093/nar/gkm337. Epub 2007 May 25. Nucleic Acids Res. 2007. PMID: 17526518 Free PMC article.
References
- Berezney R., Dubey D.D., Huberman J.A. Heterogeneity of eukaryotic replicons, replicon clusters, and replication foci. Chromosoma. 2000;108:471–484. - PubMed
- Bravo R., Frank R., Blundell P.A., Macdonald-Bravo H. Cyclin/PCNA is the auxiliary protein of DNA polymerase-delta. Nature. 1987;326:515–517. - PubMed
Publication types
MeSH terms
Substances
LinkOut - more resources
Full Text Sources
Other Literature Sources
Research Materials
Miscellaneous

