The mitotic phosphorylation cycle of the cis-Golgi matrix protein GM130 - PubMed (original) (raw)
The mitotic phosphorylation cycle of the cis-Golgi matrix protein GM130
M Lowe et al. J Cell Biol. 2000.
Abstract
The cis-Golgi matrix protein GM130 is phosphorylated in mitosis on serine 25. Phosphorylation inhibits binding to p115, a vesicle-tethering protein, and has been implicated as an important step in the mitotic Golgi fragmentation process. We have generated an antibody that specifically recognizes GM130 phosphorylated on serine 25, and used this antibody to study the temporal regulation of phosphorylation in vivo. GM130 is phosphorylated in prophase as the Golgi complex starts to break down, and remains phosphorylated during further breakdown and partitioning of the Golgi fragments in metaphase and anaphase. In telophase, GM130 is dephosphorylated as the Golgi fragments start to reassemble. The timing of phosphorylation and dephosphorylation correlates with the dissociation and reassociation of p115 with Golgi membranes. GM130 phosphorylation and p115 dissociation appear specific to mitosis, since they are not induced by several drugs that trigger nonmitotic Golgi fragmentation. The phosphatase responsible for dephosphorylation of mitotic GM130 was identified as PP2A. The active species was identified as heterotrimeric phosphatase containing the Balpha regulatory subunit, suggesting a role for this isoform in the reassembly of mitotic Golgi membranes at the end of mitosis.
Figures
Figure 1
Specificity of the anti-phosphoserine 25 antibodies by Western blotting. (A) Left panel: Rat liver Golgi membranes were incubated with interphase (I) or mitotic (M) cytosol, reisolated by centrifugation, solubilized in SDS sample buffer, and subjected to Western blotting with antibodies against phosphoserine 25 (PS25) or the NH2 terminus of GM130 (GM130). Middle panel: Interphase (I) or mitotic (M) NRK cells were lysed in buffer containing Triton X-100, and solubilized proteins analyzed by Western blotting with antibodies against phosphoserine 25 (PS25) or the NH2 terminus of GM130 (GM130). The asterisk denotes a cross-reacting protein of unknown identity found in interphase and mitotic lysates. Right panel: GM130 was immunoprecipitated (IP) from Triton X-100 solubilized interphase (I) and mitotic (M) NRK cells with a monoclonal anti-GM130 antibody before analysis by Western blotting with antibodies against phosphoserine 25 (PS25) or the NH2 terminus of GM130 (GM130). Molecular mass markers are shown in kD. (B) Mitotic Golgi membranes were analyzed by Western blotting with antibodies to phosphoserine 25 (PS25) or the NH2 terminus of GM130 (GM130) in the absence or presence of the indicated molar excess of the phosphoserine 25 (PS25pep) or unphosphorylated (nonPSpep) peptide. GM130 appears as a doublet, most likely due to proteolytic cleavage.
Figure 2
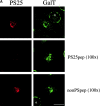
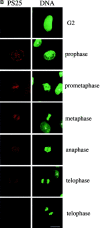
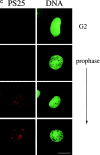
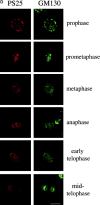
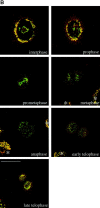
Mitotic phosphorylation of GM130 analyzed by immunofluorescence microscopy. (A) Specificity of the anti-PS25 antibodies. Methanol-fixed NRK cells were double-labeled with antibodies to phosphoserine 25 (PS25) and β-1,4 galactosyltransferase (GalT) in the absence (upper panel) or presence of a 100-fold molar excess of the phosphoserine 25 (PS25pep, middle panel) or unphosphorylated (nonPSpep, lower panel) peptide. Representative cells in interphase (indicated by an asterisk) and prometaphase (unmarked) are shown. Bar, 20 μm. (B) Phosphorylation of GM130 at different stages of mitosis. NRK cells were synchronized to enrich for mitotic cells, fixed in methanol, and double-labeled with antibodies to phosphoserine 25 (PS25) and the nucleic acid stain SYTO 13 (DNA) to identify mitotic stages. The cell in the bottom panel is a later stage of telophase than the cell in the panel directly above. Interphase cells are marked by an asterisk. Bar, 20 μm. (C) GM130 phosphorylation in prophase. Synchronized NRK cells were fixed in methanol and double-labeled with antibodies to phosphoserine 25 (PS25) and the nucleic acid stain SYTO 13 (DNA). The upper panel shows a G2 cell with no chromatin condensation. The middle two panels show prophase cells with condensed chromatin that are either negative or positive for PS25. The bottom panel shows a late prophase cell with highly condensed chromatin which is PS25 positive. Bar, 20 μm. (D) Phosphorylation of GM130 and Golgi division in mitosis. NRK cells were synchronized to enrich for mitotic cells, fixed in methanol, and double-labeled with antibodies to phosphoserine 25 (PS25) and total GM130 (GM130). Mitotic stages were determined using the DNA binding dye Hoechst 33342. Interphase cells are marked by an asterisk. Bar, 20 μm.
Figure 3
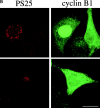
Mitotic phosphorylation of GM130 precedes nuclear envelope breakdown and coincides with nuclear translocation of cyclin B1. (A) Phosphorylation of GM130 before nuclear envelope breakdown. Methanol-fixed NRK cells were double-labeled with antibodies to phosphoserine 25 (PS25) and lamin B. Examples of cells with phosphorylated GM130 and an intact (upper panel), partially disassembled (middle panel), and fully disassembled (lower panel) nuclear envelope are shown. Interphase cells are marked with an asterisk. Bar, 20 μm. (B) Phosphorylation of GM130 and translocation of cyclin B1 into the nucleus. Methanol-fixed HeLa cells were double-labeled with antibodies to phosphoserine 25 (PS25) and cyclin B1. Upper panel: a prophase cell with phosphorylated GM130 and cyclin B1 in the nucleus is shown on the left. A G2 cell, negative for phospho-GM130 and with cytoplasmic cyclin B1 is on the right. Lower panel: a prophase cell that is PS25-positive with predominantly cytoplasmic cyclin B1 is shown. Bar, 20 μm.
Figure 4
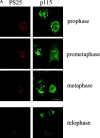
Phosphorylation of GM130 in mitosis correlates with dissociation of p115 from Golgi membranes. (A) Phosphorylation of GM130 and dissociation of p115 from Golgi membranes in vivo. Methanol-fixed NRK cells were double-labeled with antibodies to phosphoserine 25 (PS25) and p115. The top three panels show cells in prophase, prometaphase, or metaphase, and include an interphase cell (marked with an asterisk) for comparison. In the bottom panel, two cells are shown, one in early telophase (bottom) and one in late telophase (top). Bar, 20 μm. (B) Dissociation of p115 from Golgi membranes in vivo. Methanol-fixed NRK cells were double-labeled with antibodies against total GM130 and p115. Images are depicted as overlays of GM130 (green) and p115 (red), with regions of overlap indicated by yellow. Interphase cells are marked with an asterisk. Bar, 20 μm. (C) Phosphorylation of GM130 and dissociation of p115 from Golgi membranes in vitro. Rat liver Golgi membranes were incubated in buffer alone or in mitotic or interphase cytosol for the times indicated, and reisolated by centrifugation before solubilization in SDS sample buffer and analysis by Western blotting with antibodies to phosphoserine 25 (PS25) or p115. (D) Dephosphorylation of GM130 and reassociation of p115 with Golgi membranes in vitro. Mitotic Golgi membranes were incubated in buffer alone or in interphase cytosol supplemented with 50 ng exogenous p115 for the times indicated, and reisolated by centrifugation before solubilization in SDS sample buffer and analysis by Western blotting with antibodies to phosphoserine 25 (PS25) or p115.
Figure 5
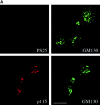
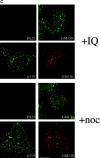
Drug-induced Golgi fragmentation independent of GM130 phosphorylation. (A) Golgi fragmentation with okadaic acid. NRK cells were treated with 1 μM okadaic acid for 1 h and double-labeled with antibodies to phosphoserine 25 (PS25) and total GM130 (upper panel), or p115 and GM130 (lower panel). Bar, 20 μm. (B) Immunoblotting of GM130 and p115 after okadaic acid treatment in vitro. Golgi membranes were incubated with interphase or mitotic cytosol for 2 or 20 min at 30°C in the absence or presence of 1 μM okadaic acid and subjected to Western blotting with antibodies to phosphoserine 25 (PS25) or p115. (C) Golgi fragmentation with IQ or nocodazole. NRK cells were treated with 25 μM IQ (upper panels) or 5 μM nocodazole (noc; lower panels) for 2 h and double-labeled with antibodies to PS25 and GM130 or p115 and GM130. Bar, 20 μm.
Figure 6
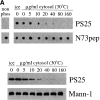
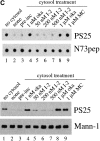
Dephosphorylation of mitotic GM130 is sensitive to low concentrations of okadaic acid. (A) Dephosphorylation of GM130 by interphase cytosol. Upper panel: N73pepPS25, the NH2-terminal GM130 peptide with phosphoserine at position 25, was incubated with increasing amounts of interphase cytosol at 30°C, before spotting onto nitrocellulose and probing with antibodies against phosphoserine 25 (PS25) or the whole NH2-terminal peptide (N73pep). The panel on the left shows an equivalent spot of the NH2-terminal peptide with a nonphosphorylated serine at position 25. Lower panel: Mitotically-treated Golgi membranes were incubated with increasing amounts of interphase cytosol, solubilized in SDS sample buffer, and analyzed by Western blotting with antibodies to phosphoserine 25 (PS25) or mannosidase I (Mann-1). (B) Sensitivity of the GM130 phosphatase to okadaic acid. Upper panel: The N73pepPS25 peptide was incubated in the absence of cytosol (−) or with 20 μg/ml interphase cytosol in the presence of increasing amounts of okadaic acid. Dephosphorylation was monitored by blotting with antibodies to phosphoserine 25 (PS25) or the whole peptide (N73pep). Lower panel: Mitotic Golgi membranes were incubated in the absence of cytosol (−) or with 20 μg/ml interphase cytosol in the presence of increasing amounts of okadaic acid. The membranes were then solubilized in SDS sample buffer and analyzed by Western blotting with antibodies to phosphoserine 25 (PS25) or mannosidase I (Mann-1). (C) The GM130 phosphatase is insensitive to inhibitor-2. The N73pepPS25 peptide (upper panel) or mitotic Golgi membranes (lower panel) were incubated in the absence of cytosol (no cytosol) or with interphase cytosol in the absence (none) or presence of the inhibitors indicated (oka, okadaic acid; I-2, inhibitor-2; MC, microcystin-LR) before analysis by blotting with antibodies to phosphoserine 25 (PS25), the NH2-terminal peptide (N73pep) or mannosidase I (Mann-1). In some cases the cytosol was preincubated for 15 min in the absence (lane 3) or presence of increasing amounts of inhibitor-2 (lanes 5–7) before addition of the peptide or membranes. The activity of each inhibitor was confirmed by testing their ability to inhibit the phosphatase activity of cytosol or purified PP1 and PP2A using phosphorylase a as control substrate (data not shown).
Figure 7
Dephosphorylation of GM130 by purified phosphatases. The N73pepPS25 peptide (upper panel) or mitotic Golgi membranes (lower panel) were incubated with increasing amounts of purified PP1 or PP2A before immunoblotting with antibodies to phosphoserine 25 (PS25), the NH2-terminal peptide (N73pep) or mannosidase I (Mann-1). Equivalent amounts of PP1 or PP2A were added in each case, as assayed using the control substrate phosphorylase a (data not shown). Relative phosphorylase phosphatase activities added were 1 (lanes 2 and 8), 2 (lanes 3 and 9), 4 (lanes 4 and 10), 8 (lanes 5 and 11), and 16 (lanes 6 and 12).
Figure 8
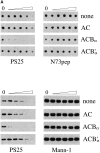
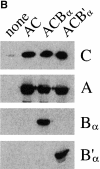
Isoform-specific dephosphorylation of GM130 by PP2A. (A) Dephosphorylation of GM130 by PP2A isoforms. Baculovirus recombinants were used to express PP2A subunits in various combinations in insect cells. Cells were harvested 64–72 h after infection and lysates were tested for their ability to dephosphorylate the N73pepPS25 peptide (upper panel) or mitotic GM130 on Golgi membranes (lower panel). Amounts of each lysate added were (from left to right): 1, 2, 4, 8, and 16 μl. Each lysate had a similar phosphatase activity assayed using phosphorylase a as the substrate. Relative phosphorylase a phosphatase activities were 1, 1.6, 1.6, and 0.95 for none, AC, ACBα, and ACB′α lysates, respectively. Noninfected Sf9 cells (none) had a detectable level of GM130 phosphatase activity, which was not increased by expression of the AC subunits alone or in combination with the B′α subunit. In contrast, the Bα subunit significantly increased activity directed against phospho-GM130. (B) Subunit expression analyzed by Western blotting. Equivalent amounts of lysates from uninfected Sf9 cells (none) or cells infected with recombinants expressing the AC, ACBα, or ACB′α subunits of PP2A were subjected to SDS-PAGE and Western blotting with antibodies specific for the catalytic subunit (C), the A subunit, or the Bα or B′α regulatory subunits.
Figure 9
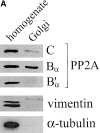
Localization of the Bα regulatory subunit of PP2A to Golgi membranes. (A) Equal amounts (10 μg) of rat liver homogenate or purified rat liver Golgi membranes (purified 200-fold over homogenate) were subjected to SDS-PAGE and Western blotting with antibodies specific for the PP2A catalytic subunit (C), PP2A Bα or B′α regulatory subunits, vimentin, or α-tubulin. (B) Purified rat liver Golgi membranes were further fractionated by flotation on a discontinuous sucrose gradient. Fractions were collected from the top, and proteins precipitated with methanol/chloroform before analysis by SDS-PAGE and Western blotting with antibodies specific for mannosidase I (Mann-1), or the catalytic (C) or Bα subunits of PP2A. L, load. The positions of the 0.4–1 M sucrose (I), 1–1.2 M sucrose (II), and 1.2–1.6 M sucrose (III) interfaces are shown.
Comment in
- W(h)ither the Golgi during mitosis?
Nelson WJ. Nelson WJ. J Cell Biol. 2000 Apr 17;149(2):243-8. doi: 10.1083/jcb.149.2.243. J Cell Biol. 2000. PMID: 10769017 Free PMC article. Review. No abstract available.
Similar articles
- The vesicle docking protein p115 binds GM130, a cis-Golgi matrix protein, in a mitotically regulated manner.
Nakamura N, Lowe M, Levine TP, Rabouille C, Warren G. Nakamura N, et al. Cell. 1997 May 2;89(3):445-55. doi: 10.1016/s0092-8674(00)80225-1. Cell. 1997. PMID: 9150144 - Phosphorylation of the vesicle-tethering protein p115 by a casein kinase II-like enzyme is required for Golgi reassembly from isolated mitotic fragments.
Dirac-Svejstrup AB, Shorter J, Waters MG, Warren G. Dirac-Svejstrup AB, et al. J Cell Biol. 2000 Aug 7;150(3):475-88. doi: 10.1083/jcb.150.3.475. J Cell Biol. 2000. PMID: 10931861 Free PMC article. - The role of the tethering proteins p115 and GM130 in transport through the Golgi apparatus in vivo.
Seemann J, Jokitalo EJ, Warren G. Seemann J, et al. Mol Biol Cell. 2000 Feb;11(2):635-45. doi: 10.1091/mbc.11.2.635. Mol Biol Cell. 2000. PMID: 10679020 Free PMC article. - Emerging new roles of GM130, a cis-Golgi matrix protein, in higher order cell functions.
Nakamura N. Nakamura N. J Pharmacol Sci. 2010;112(3):255-64. doi: 10.1254/jphs.09r03cr. Epub 2010 Mar 2. J Pharmacol Sci. 2010. PMID: 20197635 Review. - Mitotic disassembly and reassembly of the Golgi apparatus.
Levine TP, Misteli T, Rabouille C, Warren G. Levine TP, et al. Cold Spring Harb Symp Quant Biol. 1995;60:549-57. doi: 10.1101/sqb.1995.060.01.058. Cold Spring Harb Symp Quant Biol. 1995. PMID: 8824427 Review. No abstract available.
Cited by
- GM130 Regulates Golgi-Derived Spindle Assembly by Activating TPX2 and Capturing Microtubules.
Wei JH, Zhang ZC, Wynn RM, Seemann J. Wei JH, et al. Cell. 2015 Jul 16;162(2):287-299. doi: 10.1016/j.cell.2015.06.014. Epub 2015 Jul 9. Cell. 2015. PMID: 26165940 Free PMC article. - Dysregulation of stathmin, a microtubule-destabilizing protein, and up-regulation of Hsp25, Hsp27, and the antioxidant peroxiredoxin 6 in a mouse model of familial amyotrophic lateral sclerosis.
Strey CW, Spellman D, Stieber A, Gonatas JO, Wang X, Lambris JD, Gonatas NK. Strey CW, et al. Am J Pathol. 2004 Nov;165(5):1701-18. doi: 10.1016/S0002-9440(10)63426-8. Am J Pathol. 2004. PMID: 15509539 Free PMC article. - Phospholipase D2 is localized to the rims of the Golgi apparatus in mammalian cells.
Freyberg Z, Bourgoin S, Shields D. Freyberg Z, et al. Mol Biol Cell. 2002 Nov;13(11):3930-42. doi: 10.1091/mbc.02-04-0059. Mol Biol Cell. 2002. PMID: 12429836 Free PMC article. - Knockout of the Golgi stacking proteins GRASP55 and GRASP65 impairs Golgi structure and function.
Bekier ME 2nd, Wang L, Li J, Huang H, Tang D, Zhang X, Wang Y. Bekier ME 2nd, et al. Mol Biol Cell. 2017 Oct 15;28(21):2833-2842. doi: 10.1091/mbc.E17-02-0112. Epub 2017 Aug 16. Mol Biol Cell. 2017. PMID: 28814501 Free PMC article. - Golgi biogenesis.
Wang Y, Seemann J. Wang Y, et al. Cold Spring Harb Perspect Biol. 2011 Oct 1;3(10):a005330. doi: 10.1101/cshperspect.a005330. Cold Spring Harb Perspect Biol. 2011. PMID: 21690214 Free PMC article. Review.
References
- Acharya U., Mallabiabarrena A., Acharya J.K., Malhotra V. Signaling via mitogen-activated protein-kinase kinase (MEK 1) is required for Golgi fragmentation during mitosis. Cell. 1998;92:183–192. - PubMed
- Ajiro K., Yoda K., Utsumi K., Nishikawa Y. Alteration of cell cycle-dependent histone phosphorylations by okadaic acid. Induction of mitosis-specific H3 phosphorylation and chromatin condensation in mammalian interphase cells. J. Biol. Chem. 1996;271:13197–13201. - PubMed
- Axton J.M., Dombradi V., Cohen P.T., Glover D.M. One of the protein phosphatase 1 isoenzymes in Drosophila is essential for mitosis. Cell. 1990;63:33–46. - PubMed
- Barr F.A., Puype M., Vandekerckhove J., Warren G. GRASP65, a protein involved in the stacking of Golgi cisternae. Cell. 1997;91:253–262. - PubMed
Publication types
MeSH terms
Substances
LinkOut - more resources
Full Text Sources
Molecular Biology Databases
Miscellaneous


