Lsh, an SNF2/helicase family member, is required for proliferation of mature T lymphocytes - PubMed (original) (raw)
Lsh, an SNF2/helicase family member, is required for proliferation of mature T lymphocytes
T M Geiman et al. Proc Natl Acad Sci U S A. 2000.
Abstract
Lsh (Hells) is closely related to SNF2/helicase family members that remodel chromatin and thus regulate gene transcription. In the adult mouse Lsh is expressed primarily in lymphoid tissue, showing the highest level in thymocytes. Lsh gene expression can be induced in thymic pro-T cells by pre-T cell receptor crosslinking and in mature T cells by T cell receptor crosslinking together with costimulation via CD28. The time course of Lsh gene and protein expression correlated closely with the onset of S phase of the cell cycle. To explore the function of Lsh during lymphoid development or activation, we deleted the Lsh gene by homologous recombination in ES cells. Fetal liver cells from Lsh-/- were used as a source of hematopoietic precursors to reconstitute lymphoid development in Rag2-/- mice. Lsh-/- (compared to Lsh+/+ or +/-) chimeras showed a modest reduction in thymocyte numbers due to a partial arrest at the transition from the CD4(-)CD8(-) stage to the CD4(+)CD8(+) stage of T cell development. Mature peripheral lymphocytes were reduced in number to approximately 60% for T cells and 40% for B cells; however, V(D)J recombination of the immune receptor genes was normal. Although polyclonal activation of Lsh-/- T cells induced normal levels of cytokines, cell proliferation was severely suppressed and cells underwent apoptosis. Several genes involved in the regulation of apoptosis were expressed normally with the exception of Bcl-2 that was actually elevated. These findings demonstrate that Lsh is not obligatory for normal lymphoid development but is essential for normal proliferation of peripheral T lymphocytes.
Figures
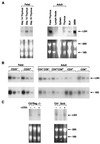
Figure 1
Expression of Lsh mRNA in lymphoid tissue. (A) Lsh mRNA expression in fetal vs. adult lymphoid tissue. Embryonal thymi were removed at day 14, 15, or 16 of gestation (left) or thymus, spleen, and lymph node were removed from 4–8 wk old adults (right) and compared to fetal thymus (day 15). EL4 is a T cell line and 38B9 is a pre-B cell line. Total RNA was extracted and subjected to Northern analysis by using a 2.2-kb Lsh cDNA probe comprising the whole ORF. (B) Lsh mRNA expression in T cell precursor populations. Fetal (day 14) or adult thymus were stained with the indicated antibodies and sorted by flow cytometry. Total RNA was extracted and subjected to RT-PCR analysis (1/5 serial dilutions) for specific detection of Lsh or 18s (control) mRNA. (C) Induction of Lsh mRNA by pre-TCR signaling. Rag2−/− and SCID mice were injected with anti-CD3 antibodies and the thymus removed 6 d later for Northern analysis as in A.
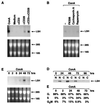
Figure 2
Induction of LSH gene expression in mature T lymphocytes. (A) Induction of Lsh mRNA by CD3 and CD28 costimulation. Splenocytes were cultured for 48 h in the presence of the indicated stimuli and Northern analysis performed as in Fig. 1_A_. (B) Inhibition of Lsh mRNA by immunosuppressive drugs. Splenocytes from animals were cultured for 48 h with ConA in the presence or absence of the immunosuppressive drugs cyclosporine A, FK506, or rapamycin, and Northern analysis was performed as in Fig. 1_A_. (C) Time kinetics of Lsh mRNA expression. Splenocytes were stimulated for 2–72 h with ConA, and Northern analysis was performed as in Fig. 1_A_. (D) Time kinetics of Lsh protein expression. Splenocytes were stimulated for 24–96 h with ConA. Nuclear and cytoplasmic protein was extracted and subjected to Western analysis using rabbit antiserum against the C-terminal peptide of Lsh. (E) Time kinetic of cell cycle induction of ConA-activated splenocytes. Splenocytes were stimulated for 2–72 h with ConA and analyzed by flow cytometry for cell cycle.
Figure 3
Effect of Lsh deletion on lymphoid development. (A) Absence of Lsh protein in Lsh−/− splenocytes. Fetal liver cell suspensions of the indicated Lsh genotype were injected into Rag-2−/− recipients and spleens harvested after 4–5 wk. Splenocytes were cultured for 48 h with ConA, nuclear protein extracted, and subjected to Western analysis using rabbit antiserum against the C-terminal peptide of Lsh. (B) Lsh−/− (○, n = 11) chimeric thymus and spleen cell numbers were evaluated and compared to cell numbers generated from + /+ mice (▵, n = 9). No statistically significant difference in thymic or spleen cell numbers was found between + /+ or ± animals. Statistically relevant differences are indicated as P values below. (C) Lsh−/− chimeras (○, n = 11) were analyzed for the thymic subpopulation surface markers CD4 and CD8 by FACs and compared to control +/+ animals (▵, n = 8). Statistically relevant differences are indicated as P values below. (D) Lsh−/− spleen chimeras (○, n = 9) were analyzed by FACs for expression of T cell surface markers CD3, CD4, and CD8 or B cell surface markers B220 and IgM and compared to spleen from + /+ animals (▵, n = 7). Statistically relevant differences are indicated as P values below. (E) Genomic DNA from either thymus or spleen of Lsh−/− or Lsh+/+ chimeric animals was analyzed for V(D)J recombination at the TCRα, β, or γ locus or the IgH chain locus (D-JH4, V7183, J558). The control reactions amplified the Vγ2 gene independent of the recombination event. Only the control reactions for spleen samples are shown.
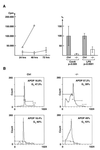
Figure 4
Analysis of proliferation and cell cycle in Lsh−/− chimeras. (A) Effect of Lsh on thymidine incorporation. Fetal liver cell suspensions of the Lsh−/− (○) or control embryos (± ▵) were injected into Rag-2−/− recipients and spleens harvested after 5 wk. Splenocytes were stimulated with ConA for the indicated times (left) or with ConA or LPS for 48 h until thymidine incorporation was measured (right; data summarizes two experiments with Lsh−/− (n = 4) and control (n = 7). (B) Lsh−/− or + /+ spleen cells were subjected to cell cycle analysis after stimulation with ConA for 48 h. Number of cells undergoing apoptosis or in G1 phase of cell cycle are indicated in the upper right corner of two representative Lsh−/− individual mice (n = 10) and two + /+ controls (n = 10).
Figure 5
Analysis of expression of genes involved in cell cycle or apoptosis. Fetal liver cell suspensions of the indicated Lsh genotype were injected into Rag-2−/− recipients and spleens harvested after 5 wk. Splenocytes were cultured for 48 h with ConA (a) or for 24 and 48 h (b), total RNA extracted, and subjected to RT-PCR analysis for detection of the indicated genes.
Similar articles
- Lsh, a SNF2 family member, is required for normal murine development.
Geiman TM, Tessarollo L, Anver MR, Kopp JB, Ward JM, Muegge K. Geiman TM, et al. Biochim Biophys Acta. 2001 May 3;1526(2):211-20. doi: 10.1016/s0304-4165(01)00129-5. Biochim Biophys Acta. 2001. PMID: 11325543 - Retinoid-related orphan receptor gamma (RORgamma) is essential for lymphoid organogenesis and controls apoptosis during thymopoiesis.
Kurebayashi S, Ueda E, Sakaue M, Patel DD, Medvedev A, Zhang F, Jetten AM. Kurebayashi S, et al. Proc Natl Acad Sci U S A. 2000 Aug 29;97(18):10132-7. doi: 10.1073/pnas.97.18.10132. Proc Natl Acad Sci U S A. 2000. PMID: 10963675 Free PMC article. - Lsh/HELLS is required for B lymphocyte development and immunoglobulin class switch recombination.
He Y, Ren J, Xu X, Ni K, Schwader A, Finney R, Wang C, Sun L, Klarmann K, Keller J, Tubbs A, Nussenzweig A, Muegge K. He Y, et al. Proc Natl Acad Sci U S A. 2020 Aug 18;117(33):20100-20108. doi: 10.1073/pnas.2004112117. Epub 2020 Jul 29. Proc Natl Acad Sci U S A. 2020. PMID: 32727902 Free PMC article. - Fidelity and infidelity in commitment to B-lymphocyte lineage development.
Rolink AG, Schaniel C, Busslinger M, Nutt SL, Melchers F. Rolink AG, et al. Immunol Rev. 2000 Jun;175:104-11. Immunol Rev. 2000. PMID: 10933595 Review. - Lymphoid-specific helicase in epigenetics, DNA repair and cancer.
Chen X, Li Y, Rubio K, Deng B, Li Y, Tang Q, Mao C, Liu S, Xiao D, Barreto G, Tao Y. Chen X, et al. Br J Cancer. 2022 Feb;126(2):165-173. doi: 10.1038/s41416-021-01543-2. Epub 2021 Sep 7. Br J Cancer. 2022. PMID: 34493821 Free PMC article. Review.
Cited by
- The chromatin remodelling protein LSH/HELLS regulates the amount and distribution of DNA hydroxymethylation in the genome.
De Dieuleveult M, Bizet M, Colin L, Calonne E, Bachman M, Li C, Stancheva I, Miotto B, Fuks F, Deplus R. De Dieuleveult M, et al. Epigenetics. 2022 Apr;17(4):422-443. doi: 10.1080/15592294.2021.1917152. Epub 2021 May 7. Epigenetics. 2022. PMID: 33960278 Free PMC article. - CDCA7 and HELLS mutations undermine nonhomologous end joining in centromeric instability syndrome.
Unoki M, Funabiki H, Velasco G, Francastel C, Sasaki H. Unoki M, et al. J Clin Invest. 2019 Jan 2;129(1):78-92. doi: 10.1172/JCI99751. Epub 2018 Nov 19. J Clin Invest. 2019. PMID: 30307408 Free PMC article. - Germinal center output is sustained by HELLS-dependent DNA-methylation-maintenance in B cells.
Cousu C, Mulot E, De Smet A, Formichetti S, Lecoeuche D, Ren J, Muegge K, Boulard M, Weill JC, Reynaud CA, Storck S. Cousu C, et al. Nat Commun. 2023 Sep 14;14(1):5695. doi: 10.1038/s41467-023-41317-3. Nat Commun. 2023. PMID: 37709749 Free PMC article. - The ATP binding site of the chromatin remodeling homolog Lsh is required for nucleosome density and de novo DNA methylation at repeat sequences.
Ren J, Briones V, Barbour S, Yu W, Han Y, Terashima M, Muegge K. Ren J, et al. Nucleic Acids Res. 2015 Feb 18;43(3):1444-55. doi: 10.1093/nar/gku1371. Epub 2015 Jan 10. Nucleic Acids Res. 2015. PMID: 25578963 Free PMC article. - Genome-wide DNA methylation patterns in LSH mutant reveals de-repression of repeat elements and redundant epigenetic silencing pathways.
Yu W, McIntosh C, Lister R, Zhu I, Han Y, Ren J, Landsman D, Lee E, Briones V, Terashima M, Leighty R, Ecker JR, Muegge K. Yu W, et al. Genome Res. 2014 Oct;24(10):1613-23. doi: 10.1101/gr.172015.114. Epub 2014 Aug 28. Genome Res. 2014. PMID: 25170028 Free PMC article.
References
- Imbalzano A N. Crit Rev Eukaryotic Gene Expression. 1998;8:225–255. - PubMed
- Jarvis C D, Geiman T, Vila-Storm M P, Osipovich O, Akella U, Candeias S, Nathan I, Durum S K, Muegge K. Gene. 1996;169:203–207. - PubMed
- Geiman T M, Durum S K, Muegge K. Genomics. 1998;54:477–483. - PubMed
- Haks M C, Oosterwegel M A, Blom B, Spits H M, Kruisbeek A M. Semin Immunol. 1999;11:23–37. - PubMed
Publication types
MeSH terms
Substances
LinkOut - more resources
Full Text Sources
Other Literature Sources
Molecular Biology Databases
Research Materials


