Caspase-2 is localized at the Golgi complex and cleaves golgin-160 during apoptosis - PubMed (original) (raw)
Caspase-2 is localized at the Golgi complex and cleaves golgin-160 during apoptosis
M Mancini et al. J Cell Biol. 2000.
Abstract
Caspases are an extended family of cysteine proteases that play critical roles in apoptosis. Animals deficient in caspases-2 or -3, which share very similar tetrapeptide cleavage specificities, exhibit very different phenotypes, suggesting that the unique features of individual caspases may account for distinct regulation and specialized functions. Recent studies demonstrate that unique apoptotic stimuli are transduced by distinct proteolytic pathways, with multiple components of the proteolytic machinery clustering at distinct subcellular sites. We demonstrate here that, in addition to its nuclear distribution, caspase-2 is localized to the Golgi complex, where it cleaves golgin-160 at a unique site not susceptible to cleavage by other caspases with very similar tetrapeptide specificities. Early cleavage at this site precedes cleavage at distal sites by other caspases. Prevention of cleavage at the unique caspase-2 site delays disintegration of the Golgi complex after delivery of a pro-apoptotic signal. We propose that the Golgi complex, like mitochondria, senses and integrates unique local conditions, and transduces pro-apoptotic signals through local caspases, which regulate local effectors.
Figures
Figure 1
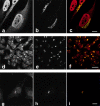
Caspase-2 is localized to the nucleus and Golgi in HeLa cells. HeLa cells (a–f) or HeLa cells stably expressing GFP-golgin-160 (g–i) were fixed, permeabilized, and double-labeled with anti–caspase-2 (a, d, and g) and antigiantin (b and e) or anti-GFP (h). The stained cells were examined by confocal immunofluorescence microscopy. When red (caspase-2) and green (giantin or GFP) images were merged, overlapping red and green pixels appeared orange/yellow (c, f, and i). An identical caspase-2 staining pattern was observed using several different anti–caspase-2 antibodies: affinity-purified MF386, a polyclonal rabbit antiserum raised against the large subunit of caspase-2 (a–c); sc-623, a polyclonal rabbit antiserum raised against an NH2-terminal peptide of caspase-2 precursor (d–f); and anti-ICH-1L, an mAb raised against a peptide encompassing residues 225–401 of caspase-2 (g–i). MF388, a second rabbit antiserum raised against the large subunit of caspase-2, also showed identical staining (data not shown). The experiments were repeated on 11 (a–c), 5 (d–f), or 3 (g–i) separate occasions with identical results. Bars: (a–c and g-i) 10 μm; 25 μm (d–f).
Figure 2
Golgin-160 is cleaved during apoptosis. HeLa cells were incubated for 2 h with 1 μm staurosporine. Lysates from control and treated cells were run on a 7.5% SDS-PAGE and immunoblotted with rabbit anti–golgin-160 antiserum. 70 μg of lysate was loaded in each lane. Results are representative of three separate experiments.
Figure 3
Caspases-2, -3, and -7 cleave golgin-160 in vitro at unique sites and generate distinct fragments. [35S]methionine-labeled golgin-160 was expressed using IVTT, and was incubated for 1 h at 37°C with purified caspases-2, -3, or -7. Intact and cleaved golgin-160 were detected by autoradiography. (a) Cleavage with caspase-2 generated a predominant fragment of 163 kD and another of 140 kD. Mutation of aspartic acid to alanine at the amino acid position 59 (D59A) specifically abolished the generation of the unique 163-kD caspase-2–generated fragment, and the D311A mutation abolished generation of the p140 fragment. (b) Caspase-3 cleaved golgin-160 to generate a predominant band of 155 kD and another of 140 kD. The unique p155 fragment was absent in the D139A mutant, and the p140 fragment was absent in the D311A mutant. (c) Cleavage of golgin-160 with caspase-7 generated a single fragment of 140 kD, which was absent in the D311A mutant. (d) Schematic depiction of cleavage of golgin-160 in vitro by caspases-2, -3, and -7. These results are representative of four separate experiments.
Figure 5
GFP-golgin-160 and GFP-golgin-160(D59A) localize to the Golgi. Stable HeLa lines expressing either GFP-golgin-160 (GFP fused to the NH2 terminus of wild-type golgin-160) or GFP-golgin-160(D59A) (GFP fused to the NH2 terminus of the D59A golgin-160 mutant) were generated. Cells were fixed, permeabilized, double stained with anti-GM130 and anti-GFP, and examined by confocal immunofluorescence microscopy. GM-130 antibodies were visualized with goat anti–mouse IgG and assigned the color red (a and d), whereas GFP antibodies were visualized with fluorescein-conjugated goat anti–rabbit and assigned the color green (b and e). When images were merged, overlapping red and green pixels appeared orange/yellow (c and f). Experiments were repeated on four separate occasions with similar results. Bars, 10 μm.
Figure 4
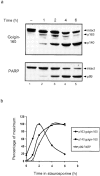
Kinetics of golgin-160 cleavage during apoptosis. (a) HeLa lysates were made at 1, 2, 4, and 6 h after addition of 1 μm staurosporine, and were run on a 7.5% (top) or 10% (bottom) SDS-PAGE. 70 μg of lysate was loaded in each lane. Golgin-160 and PARP were detected by immunoblotting with anti–golgin-160(648) or patient serum recognizing PARP, respectively. Fragments are marked on the right. (b) Graph showing a decrease of the p163 fragment concomitant with an increase in the p140 fragment. Percentage of maximum fragment plotted against time in staurosporine demonstrates that the caspase-2–generated p163 band reaches a maximum at 2 h, whereas the Group II caspase-generated p140 band reaches its maximum at 4 h in staurosporine. The kinetics of the formation of the p140 fragment of golgin-160 is very similar to that for the p89 fragment of PARP.
Figure 7
The NH2-terminal fragment of golgin-160 is released from Golgi membranes after cleavage by caspase-2. Untreated HeLa cells (a–d) and HeLa cells treated with 1 μm staurosporine for 1 h (e–h) were fixed, permeabilized, and triple labeled with anti–golgin-160(N) (a and e), which was visualized as red; antigiantin (b and f), which was visualized as green; and DAPI (c and g), which was visualized as blue. Overlapping red and green pixels appear yellow (d and h). Arrow in h denotes an apoptotic cell, which no longer stains for the NH2-terminal portion of golgin-160. These results are representative of three separate experiments. Bars, 10 μm.
Figure 6
Golgin-160 is cleaved at D59 in vivo during staurosporine-induced apoptosis. (a) The stable HeLa lines expressing GFP-golgin-160 or GFP-golgin-160(D59A) were incubated with 1 μm staurosporine for 4 h. Lysates from untreated and treated cells were run on 7.5% SDS-PAGE and immunoblotted with rabbit anti-GFP. Incubation with staurosporine resulted in a decrease of the intact GFP-golgin-160 molecule in both wt and D59A mutant cells. A 38-kD fragment was detected only in staurosporine-treated golgin-160 wild-type cells and not in the staurosporine-treated golgin-160(D59A) mutant line, which instead showed an increased level of the p47 fragment. (b) The GFP-golgin-160 and GFP-golgin-160(D59A) stable HeLa lines were labeled with [35S]Met/Cys for 1 h and chased for 8 h with or without 1 μm staurosporine for different periods of time. GFP-containing fragments of golgin-160 were immunoprecipitated with rabbit anti-GFP from lysates from both untreated and staurosporine-treated cells. Staurosporine treatment resulted in the disappearance of intact GFP-golgin-160 in both wt (4 h) and D59A (6 h). A p38 fragment was detected only in staurosporine-treated GFP-golgin-160 wt cells and not in staurosporine-treated GFP-golgin-160(D59A) mutant cells. In contrast, a single fragment at 47 kD was immunoprecipitated from these D59A mutant cells. At the top is a schematic depiction showing the predicted sizes of NH2-terminal fragments of GFP-golgin-160 when cleavage occurs at the unique caspase-2 and caspase-3 cleavage sites. Experiments were performed on three (a) or five (b) separate occasions with similar results.
Figure 8
Golgin-160 cleavage at D59 by caspase-2 contributes to the disintegration of the Golgi complex during apoptosis. The stable HeLa cell lines expressing GFP-golgin-160 (wt) or GFP-golgin-160(D59A) were left untreated or incubated with 1 μm staurosporine (STS) for 2.5 h. (a) GFP-golgin-160–expressing cells from these four groups were assessed for their Golgi morphology (intact versus scattered), and plotted as a percentage of total counted cells. Error bars represent the SD. **P = 0.0028 as determined by the t test (comparing percentages of scattered Golgi in staurosporine-treated wt versus staurosporine-treated D59A). (b) Representative cell with intact Golgi. (c) Representative cells with scattered Golgi. Bar, 10 μm.
Similar articles
- The NH2-terminal domain of Golgin-160 contains both Golgi and nuclear targeting information.
Hicks SW, Machamer CE. Hicks SW, et al. J Biol Chem. 2002 Sep 27;277(39):35833-9. doi: 10.1074/jbc.M206280200. Epub 2002 Jul 18. J Biol Chem. 2002. PMID: 12130652 - Caspase-resistant Golgin-160 disrupts apoptosis induced by secretory pathway stress and ligation of death receptors.
Maag RS, Mancini M, Rosen A, Machamer CE. Maag RS, et al. Mol Biol Cell. 2005 Jun;16(6):3019-27. doi: 10.1091/mbc.e04-11-0971. Epub 2005 Apr 13. Mol Biol Cell. 2005. PMID: 15829563 Free PMC article. - Caspase-mediated cleavage of the stacking protein GRASP65 is required for Golgi fragmentation during apoptosis.
Lane JD, Lucocq J, Pryde J, Barr FA, Woodman PG, Allan VJ, Lowe M. Lane JD, et al. J Cell Biol. 2002 Feb 4;156(3):495-509. doi: 10.1083/jcb.200110007. Epub 2002 Jan 28. J Cell Biol. 2002. PMID: 11815631 Free PMC article. - Proteases for cell suicide: functions and regulation of caspases.
Chang HY, Yang X. Chang HY, et al. Microbiol Mol Biol Rev. 2000 Dec;64(4):821-46. doi: 10.1128/MMBR.64.4.821-846.2000. Microbiol Mol Biol Rev. 2000. PMID: 11104820 Free PMC article. Review. - Caspases and their substrates.
Julien O, Wells JA. Julien O, et al. Cell Death Differ. 2017 Aug;24(8):1380-1389. doi: 10.1038/cdd.2017.44. Epub 2017 May 12. Cell Death Differ. 2017. PMID: 28498362 Free PMC article. Review.
Cited by
- The asymmetrical structure of Golgi apparatus membranes revealed by in situ atomic force microscope.
Xu H, Su W, Cai M, Jiang J, Zeng X, Wang H. Xu H, et al. PLoS One. 2013 Apr 16;8(4):e61596. doi: 10.1371/journal.pone.0061596. Print 2013. PLoS One. 2013. PMID: 23613878 Free PMC article. - Parecoxib suppresses CHOP and Foxo1 nuclear translocation, but increases GRP78 levels in a rat model of focal ischemia.
Ye Z, Wang N, Xia P, Wang E, Liao J, Guo Q. Ye Z, et al. Neurochem Res. 2013 Apr;38(4):686-93. doi: 10.1007/s11064-012-0953-4. Epub 2013 Jan 17. Neurochem Res. 2013. PMID: 23325452 - Caspase-2 promotes AMPA receptor internalization and cognitive flexibility via mTORC2-AKT-GSK3β signaling.
Xu ZX, Tan JW, Xu H, Hill CJ, Ostrovskaya O, Martemyanov KA, Xu B. Xu ZX, et al. Nat Commun. 2019 Aug 9;10(1):3622. doi: 10.1038/s41467-019-11575-1. Nat Commun. 2019. PMID: 31399584 Free PMC article. - More than one way to go.
Wyllie AH, Golstein P. Wyllie AH, et al. Proc Natl Acad Sci U S A. 2001 Jan 2;98(1):11-3. doi: 10.1073/pnas.98.1.11. Proc Natl Acad Sci U S A. 2001. PMID: 11136242 Free PMC article. No abstract available. - ER Stress Drives Lipogenesis and Steatohepatitis via Caspase-2 Activation of S1P.
Kim JY, Garcia-Carbonell R, Yamachika S, Zhao P, Dhar D, Loomba R, Kaufman RJ, Saltiel AR, Karin M. Kim JY, et al. Cell. 2018 Sep 20;175(1):133-145.e15. doi: 10.1016/j.cell.2018.08.020. Epub 2018 Sep 13. Cell. 2018. PMID: 30220454 Free PMC article.
References
- Ashkenazi A., Dixit V.M. Death receptorssignaling and modulation. Science. 1998;281:1305–1308. - PubMed
- Bennett M., Macdonald K., Chan S.W., Luzio J.P., Simari R., Weissberg P. Cell surface trafficking of Fasa rapid mechanism of p53-mediated apoptosis. Science. 1998;282:290–293. - PubMed
- Butt A.J., Harvey N.L., Parasivam G., Kumar S. Dimerization and autoprocessing of the Nedd2 (caspase-2) precursor requires both the prodomain and the carboxyl-terminal regions. J. Biol. Chem. 1998;273:6763–6768. - PubMed
Publication types
MeSH terms
Substances
Grants and funding
- R01 AR044684/AR/NIAMS NIH HHS/United States
- R01 DE012354/DE/NIDCR NIH HHS/United States
- R37 DE012354/DE/NIDCR NIH HHS/United States
- GM42522/GM/NIGMS NIH HHS/United States
- R01 GM042522/GM/NIGMS NIH HHS/United States
- AR44684/AR/NIAMS NIH HHS/United States
- DE12354/DE/NIDCR NIH HHS/United States
LinkOut - more resources
Full Text Sources
Molecular Biology Databases
Research Materials
Miscellaneous


