Incomplete CD8(+) T lymphocyte differentiation as a mechanism for subdominant cytotoxic T lymphocyte responses to a viral antigen - PubMed (original) (raw)
Incomplete CD8(+) T lymphocyte differentiation as a mechanism for subdominant cytotoxic T lymphocyte responses to a viral antigen
J V Spencer et al. J Exp Med. 2000.
Abstract
CD8(+) cytotoxic T lymphocytes (CTLs) recognize antigen in the context of major histocompatibility complex (MHC) class I molecules. Class I epitopes have been classified as dominant or subdominant depending on the magnitude of the CTL response to the epitope. In this report, we have examined the in vitro memory CTL response of H-2(d) haplotype murine CD8(+) T lymphocytes specific for a dominant and subdominant epitope of influenza hemagglutinin using activation marker expression and staining with soluble tetrameric MHC-peptide complexes. Immune CD8(+) T lymphocytes specific for the dominant HA204-210 epitope give rise to CTL effectors that display activation markers, stain with the HA204 tetramer, and exhibit effector functions (i.e., cytolytic activity and cytokine synthesis). In contrast, stimulation of memory CD8(+) T lymphocytes directed to the subdominant HA210-219 epitope results in the generation of a large population of activated CD8(+) T cells that exhibit weak cytolytic activity and fail to stain with the HA210 tetramer. After additional rounds of restimulation with antigen, the HA210-219-specific subdominant CD8(+) T lymphocytes give rise to daughter cells that acquire antigen-specific CTL effector activity and transition from a HA210 tetramer-negative to a tetramer-positive phenotype. These results suggest a novel mechanism to account for weak CD8(+) CTL responses to subdominant epitopes at the level of CD8(+) T lymphocyte differentiation into effector CTL. The implications of these findings for CD8(+) T lymphocyte activation are discussed.
Figures
Figure 1
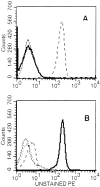
Specificity of tetramer staining on cloned CTL lines. (A) Staining of HA204-specific cloned CTL line E2 with a panel of tetramer reagents. (B) Staining of HA210-specific cloned CTL cell line D4 with the same panel of reagents. Unstained cells (dashed line), Kd–HA204 tetramer (broken line), Kd–HA210 tetramer (solid line), Kd–JAK-1 tetramer (dotted line).
Figure 2
Activation of HA-specific memory CTLs. BALB/c mice were immunized with a recombinant vaccinia virus expressing a truncated version of the HA protein. 3 wk later, immune splenocytes were stimulated in vitro with APCs infected with (A and B) AA virus (for HA204-212 responses) or (C and D) GV virus (for HA210-219 responses). 5 d after in vitro stimulation, cells were harvested and stained with anti-CD8–CyChrome and the Kd–JAK-1 or indicated HA tetramer, then analyzed by flow cytometry. Numbers in the corner of the upper right quadrant represent the percentage of total CD8+ T cells that stained positive with HA tetramer. These results are representative of five independent experiments.
Figure 3
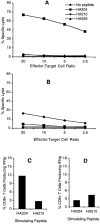
Effector activity of bulk cultures. Cytolytic activity and cytokine production by HA-specific CTLs was measured on day 5 after in vitro stimulation. For cytolysis assays, bulk immune cell populations were incubated with 51Cr-labeled P815 target cells pulsed with 10−9 M concentration of the indicated peptide over a range of E/T ratios for 5 h at 37°C. (A) AA-stimulated cultures (HA204 enriched). (B) GV-stimulated cultures (HA210 enriched). Intracellular cytokine staining was performed by incubating day 5 cells with 10−6 M HA204-212 or HA210-219 peptide–pulsed P815 target cells (E/T = 1:2) in the presence of IL-2 and monensin for 6 h at 37°C. Cells were stained with anti-CD8–CyChrome, then permeabilized and stained with anti–FITC-conjugated IFN-γ or isotype control antibody (not shown). Histogram values are the average percentage of IFN-γ–secreting CD8+ T cells in response to peptide from duplicate cultures. (C) AA-stimulated cultures (HA204 enriched). (D) GV-stimulated cultures (HA210 enriched).
Figure 4
Effect of antigenic stimulation on tetramer staining by CD8+ T cells. Immune splenocytes were stimulated once (1×) in vitro with A/AA/57-infected or GV-infected APCs to selectively activate HA204-212–specific or HA210-219–specific CD8+ T cells, respectively. Immune cell cultures were successively restimulated twice (2×, 3×) at 14-d intervals with homologous virus. 5 d after each in vitro stimulation, cells were harvested and viable cells were stained with anti-CD8–CyChrome, HA tetramer (TET) PE and either CD44-FITC or CD62L-FITC. HA204-212 cultures were stained with HA204 tetramers, and HA210-219 cultures were stained with HA210 tetramers. The values within each panel are the percentage of total CD8+ T cells that are tetramer positive and, in parentheses, the percentage of total CD8+ T cells with an activated phenotype (CD44hiCD62Llo). These results are representative of five independent experiments.
Figure 5
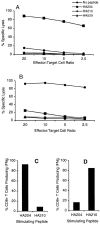
Effector activity of tertiary bulk cultures. 5 d after the third in vitro stimulation with homologous virus–infected APCs, bulk cultures were analyzed for cytolytic activity and IFN-γ production as described in the legend to Fig. 3. A and C represent activity of tertiary HA204-21–specific AA virus–stimulated cultures. B and D represent tertiary HA210-219–specific GV virus–stimulated cultures.
Figure 6
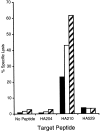
Cytolytic activity of sorted HA210 tetramer–positive and tetramer-negative CTLs. Bulk CTL populations, stimulated three times in vitro with GV virus–infected APCs, were stained with HA210 tetramer–PE and anti-CD8–FITC, then sorted via FACS® into >99% pure tetramer-positive and -negative populations. Sorted populations, as well as samples of the unsorted bulk culture, were assayed for cytolytic activity in a 51Cr-release assay using P815 target cells pulsed with 10−9 M of the indicated peptide (E/T = 5:1). These results are representative of three independent experiments. Black bars, HA210 tetramer–positive cells; white bars, HA210 tetramer–negative cells; hatched bars, unsorted tertiary GV bulk culture.
Figure 7
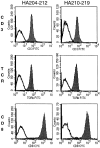
Surface expression of TCR complex on dominant and subdominant CTLs. 5 d after a third in vitro stimulation with virus-infected APCs, dominant (HA204) and subdominant (HA210) bulk cultures were stained with anti–TCR-β or anti-CD3 and anti-CD8 (solid histograms) or with corresponding isotype control antibodies (open histograms), as indicated.
Figure 8
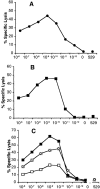
Peptide dose dependence of dominant and subdominant CTLs. On day five or six after tertiary in vitro stimulation with virus-infected APCs, cytolytic activity was examined on peptide-pulsed targets over the indicated peptide concentrations as described. (A) AA-stimulated cultures tested on HA204-212 peptide–pulsed P815 target cells. (B) GV-stimulated cultures tested on HA210-219 peptide–pulsed P815 target cells. (C) FACS®-sorted HA210 tetramer–positive (□), tetramer-negative (x), and unsorted (▪) CD8+ T cells from tertiary stimulated GV cultures tested on HA210-219–pulsed targets. Assay time was 5 h at an E/T ratio of 10:1. Values are the mean percentage of lysis of quadruplicate samples. SE values were ≤3% of mean values and are not shown. “0” indicates target cells not treated with peptide, and “529” indicates target cells treated with 10−8 M concentration of the irrelevant HA529 synthetic peptide.
Figure 9
Generation of HA210 tetramer–positive CD8+ cells from HA210 tetramer–negative cells in response to antigen. Freshly isolated immune splenocytes were stimulated one time in vitro with GV-infected APCs. At day 14 after stimulation, the residual viable cells were incubated with a 10-fold excess of PE-labeled HA210 tetramer, washed, and incubated with anti-PE antibody–coated magnetic microbeads. Tetramer-binding cells were depleted from the culture by magnetic cell separation. The column flow-through (CD8+, HA210 tetramer–negative cells) was washed and then restimulated by coculture with GV-infected APCs. 5 d after stimulation, viable cells were harvested and stained with CD8-perCP and HA210 tetramer–PE, then examined by flow cytometry. (A) Resting GV cultures on day 14 (1× GV d14). (B) Tetramer-negative column flow-through cells before stimulation (HA210 tet+ depleted). (C) Composition of cultures 5 d after stimulation of flow-through cells (2× GV d5).
Figure 10
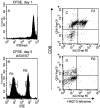
Proliferation of separated HA210 tetramer-negative cells after antigenic stimulation. Tetramer-negative cells were isolated as described in the legend to Fig. 9. Before antigenic stimulation, cells were labeled with the CFSE dye to monitor cell division. (A) CFSE fluorescence intensity of freshly labeled cells. (B) Dye intensity of CFSE-labeled cells at day 5 after stimulation with GV-infected APCs. (C and D) HA210 tetramer and CD8 staining of day 5 cells in dye peak R1 (C) and R2 (D).
Similar articles
- Efficient priming of CD8+ memory T cells specific for a subdominant epitope following Sendai virus infection.
Cole GA, Hogg TL, Coppola MA, Woodland DL. Cole GA, et al. J Immunol. 1997 May 1;158(9):4301-9. J Immunol. 1997. PMID: 9126992 - Tissue-specific regulation of CD8+ T-lymphocyte immunodominance in respiratory syncytial virus infection.
Lee S, Miller SA, Wright DW, Rock MT, Crowe JE Jr. Lee S, et al. J Virol. 2007 Mar;81(5):2349-58. doi: 10.1128/JVI.01910-06. Epub 2006 Dec 20. J Virol. 2007. PMID: 17182672 Free PMC article. - MHC class I antigen processing of Listeria monocytogenes proteins: implications for dominant and subdominant CTL responses.
Pamer EG, Sijts AJ, Villanueva MS, Busch DH, Vijh S. Pamer EG, et al. Immunol Rev. 1997 Aug;158:129-36. doi: 10.1111/j.1600-065x.1997.tb00999.x. Immunol Rev. 1997. PMID: 9314081 Review. - Activation-induced non-responsiveness (anergy) limits CD8 T cell responses to tumors.
Mescher MF, Popescu FE, Gerner M, Hammerbeck CD, Curtsinger JM. Mescher MF, et al. Semin Cancer Biol. 2007 Aug;17(4):299-308. doi: 10.1016/j.semcancer.2007.06.008. Epub 2007 Jun 23. Semin Cancer Biol. 2007. PMID: 17656106 Free PMC article. Review.
Cited by
- Different vaccine vectors delivering the same antigen elicit CD8+ T cell responses with distinct clonotype and epitope specificity.
Honda M, Wang R, Kong WP, Kanekiyo M, Akahata W, Xu L, Matsuo K, Natarajan K, Robinson H, Asher TE, Price DA, Douek DC, Margulies DH, Nabel GJ. Honda M, et al. J Immunol. 2009 Aug 15;183(4):2425-34. doi: 10.4049/jimmunol.0900581. Epub 2009 Jul 20. J Immunol. 2009. PMID: 19620307 Free PMC article. - Detuning CD8 T cells: down-regulation of CD8 expression, tetramer binding, and response during CTL activation.
Xiao Z, Mescher MF, Jameson SC. Xiao Z, et al. J Exp Med. 2007 Oct 29;204(11):2667-77. doi: 10.1084/jem.20062376. Epub 2007 Oct 22. J Exp Med. 2007. PMID: 17954566 Free PMC article. - Regulation of IFN-gamma signaling is essential for the cytotoxic activity of CD8(+) T cells.
Tau GZ, Cowan SN, Weisburg J, Braunstein NS, Rothman PB. Tau GZ, et al. J Immunol. 2001 Nov 15;167(10):5574-82. doi: 10.4049/jimmunol.167.10.5574. J Immunol. 2001. PMID: 11698428 Free PMC article. - Review on the relationship between human polyomaviruses-associated tumors and host immune system.
Delbue S, Comar M, Ferrante P. Delbue S, et al. Clin Dev Immunol. 2012;2012:542092. doi: 10.1155/2012/542092. Epub 2012 Mar 25. Clin Dev Immunol. 2012. PMID: 22489251 Free PMC article. Review.
References
- Doherty P.C., Allan W., Eichelberger M., Carding S.R. Roles of alpha beta and gamma delta T cell subsets in viral immunity. Annu. Rev. Immunol. 1992;10:123–151. - PubMed
- Askonas B.A., Taylor P.M., Esquivel F. Cytotoxic T cells in influenza infection. Ann. NY Acad. Sci. 1988;532:230–237. - PubMed
Publication types
MeSH terms
Substances
Grants and funding
- R01 AI037293/AI/NIAID NIH HHS/United States
- HL33391/HL/NHLBI NIH HHS/United States
- R01 HL071875/HL/NHLBI NIH HHS/United States
- R37 AI015608/AI/NIAID NIH HHS/United States
- R01 HL033391/HL/NHLBI NIH HHS/United States
- R01 AI015608/AI/NIAID NIH HHS/United States
- AI15608/AI/NIAID NIH HHS/United States
LinkOut - more resources
Full Text Sources
Other Literature Sources
Molecular Biology Databases
Research Materials
