Type I interferon as a powerful adjuvant for monocyte-derived dendritic cell development and activity in vitro and in Hu-PBL-SCID mice - PubMed (original) (raw)
Type I interferon as a powerful adjuvant for monocyte-derived dendritic cell development and activity in vitro and in Hu-PBL-SCID mice
S M Santini et al. J Exp Med. 2000.
Abstract
Type I interferons (IFNs) are cytokines exhibiting antiviral and antitumor effects, including multiple activities on immune cells. However, the importance of these cytokines in the early events leading to the generation of an immune response is still unclear. Here, we have investigated the effects of type I IFNs on freshly isolated granulocyte/macrophage colony-stimulating factor (GM-CSF)-treated human monocytes in terms of dendritic cell (DC) differentiation and activity in vitro and in severe combined immunodeficiency mice reconstituted with human peripheral blood leukocytes (hu-PBL-SCID) mice. Type I IFNs induced a surprisingly rapid maturation of monocytes into short-lived tumor necrosis factor (TNF)-related apoptosis-inducing ligand (TRAIL)-expressing DCs endowed with potent functional activities, superior with respect to the interleukin (IL)-4/GM-CSF treatment, as shown by FACS((R)) analyses, mixed leukocyte reaction assays with allogeneic PBLs, and lymphocyte proliferation responses to HIV-1-pulsed autologous DCs. Type I IFN induced IL-15 production and strongly promoted a T helper cell type 1 response. Notably, injection of IFN-treated HIV-1-pulsed DCs in SCID mice reconstituted with autologous PBLs resulted in the generation of a potent primary immune response, as evaluated by the detection of human antibodies to various HIV-1 antigens. These results provide a rationale for using type I IFNs as vaccine adjuvants and support the concept that a natural alliance between these cytokines and monocytes/DCs represents an important early mechanism for connecting innate and adaptive immunity.
Figures
Figure 1
Upregulation of CD80, CD86, and CD40 expression in DCs generated in the presence of type I IFN and GM-CSF. (A) Comparison with the effects induced by IL-4/GM-CSF at 3 and 6 d of culture. Freshly isolated monocytes were prepared as described in Materials and Methods. Cells were treated with GM-CSF (500 U/ml) and with 1,000 U/ml of either CIFN or IL-4. At 3 and 6 d, cell phenotype was evaluated by FACS® analysis. Each bar is representative of four separate experiments. (B) Effects of different doses of type I IFN. Freshly isolated monocytes were isolated, cultured with cytokines, and analyzed for antigen expression on day 3, as described in Materials and Methods. Representative data from one out of three experiments are shown. (C) Effects of various preparations of type I IFN. Cultures were treated with 500 U/ml of GM-CSF and 1,000 U/ml of type I IFN, as indicated. FACS® analysis was performed on day 3.
Figure 3
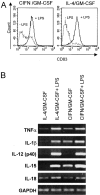
Induction of terminal maturation and cytokine expression in DCs activated with LPS. (A) Dot histogram FACS® profiles showing CD83 expression upon LPS stimulation. Monocytes were cultured with the cytokine combinations for 5 d before performing FACS® analysis. LPS (1 μg/ml) was added on day 3. (B) RT-PCR analysis of cytokine mRNA expression in DCs generated in the presence of either CIFN/GM-CSF or IL-4/GM-CSF activated or not by LPS. Cultures were treated as described for A. RNAs were extracted on day 5 and RT-PCR was performed as described in Materials and Methods. (C) Secretion of IL-15 and bioactive IL-12 p70 in DC supernatants. Cell supernatants were collected at the time of RNA extraction (B), and ELISAs were performed as described previously.
Figure 2
Phenotype of monocyte-derived DCs after 3 d of cytokine treatment. (A) Representative dot histogram FACS® profiles. Dotted lines represent the staining with isotype-matched control antibodies. (B) Dot plot FACS® analysis of DCs generated in the presence CIFN/GM-CSF for 3 d. Cells were double stained with an antibody to CD83 in conjunction with a panel of antibodies to characterize the CD83+ DC population.
Figure 5
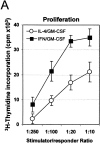
MLR assays with DCs generated in the presence of either CIFN/GM-CSF or IL-4/GM-CSF. (A) Effects of different numbers of DCs generated in the presence of either IFN/GM-CSF or IL-4/GM-CSF on the proliferative response of allogeneic monocyte–depleted PBLs. Monocyte-depleted PBLs were seeded into 96-well plates at 105 cells/well. Different numbers of purified allogeneic DCs, generated in the presence of either CIFN/GM-CSF or IL-4/GM-CSF for 3 d as indicated in Materials and Methods, were added to each well. After 5 d, thymidine incorporation was determined as described in Materials and Methods. (B) DCs generated in the presence of 1,000 U/ml of CIFN together with GM-CSF exhibit a potent allostimulatory capacity, whereas GM-CSF–treated cells obtained in the presence of 100 U/ml of IFN were poor stimulators in the MLR assay. Allogeneic PBLs were stimulated by DCs (at a stimulator/responder ratio of 1:20) previously cultured for 3 d with IFN/GM-CSF or IL-4/GM-CSF, and lymphocyte proliferation was measured as described in Materials and Methods. (C) IFN-γ production in the supernatants from MLRs. PBLs from three different donors were stimulated with allogeneic DCs generated by culturing the cells in the presence of either CIFN/GM-CSF or IL-4/GM-CSF for 3 d (stimulator/responder ratio of 1:20). IFN-γ production in the supernatants from MLRs was tested at the time of performing the lymphocyte proliferation assay (B). Each bar represents the value obtained with PBLs from different donors.
Figure 4
Enhanced apoptosis and induction of TRAIL expression in DCs generated with CIFN (1,000 U/ml) and GM-CSF (500 U/ml). (A) Dot histogram profiles showing Annexin V-GFP staining of apoptotic cells in DCs generated in the presence of either CIFN/GM-CSF or IL-4/GM-CSF cultures, analyzed after 5 d of cytokine treatment. (B) FACS® profiles of Fas and FasL expression in monocyte-derived DCs. Dotted lines represent the staining with isotype-matched control antibodies. Cells were analyzed on day 5 of culture. (C) RT-PCR analysis of TRAIL and TRAIL receptors in DCs treated or not with LPS. Monocytes were cultured with the cytokine combinations for 5 d before performing RNA extraction. LPS (1 μg/ml) was added on day 3. RT-PCR was performed as described in Materials and Methods. (D) DC-mediated killing of Jurkat cells and evaluation of the functional significance of TRAIL expression. Monocytes were cultured in the presence of IFN/GM-CSF for 5 d, washed, and resuspended in complete medium. Jurkat cells were cultured for 12 h in complete medium alone or in the presence of sTRAIL or IFN/GM-CSF DCs (E/T ratio 4:1). To evaluate the TRAIL involvement in the DC-mediated induction of apoptosis in target cells, in some cultures TRAIL-R2/Fc was added to DC effector cells 15 min before the addition of Jurkat cells. Phosphatidylserine externalization was monitored by Annexin V-GFP binding on gated Jurkat cells, as described in Materials and Methods. The percentage of Annexin V-GFP+ cells is indicated for each condition. Similar results were obtained in two additional experiments.
Figure 6
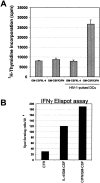
In vitro induction of a primary immune response to HIV-1 antigens in PBLs cocultivated with autologous DCs pulsed with inactivated HIV-1. (A) DCs were generated by standard treatment of freshly isolated monocytes with either CIFN/GM-CSF or IL-4/GM-CSF for 3 d as described in Materials and Methods. PBLs were stimulated on day 0 and restimulated on day 7 with the autologous DCs pulsed with AT-2–inactivated HIV-1 at a stimulator/responder ratio of 1:4. Control cultures were incubated with unpulsed autologous DCs. Exogenous IL-2 (25 U/ml) was added every 4 d. At day 14, the cultures were restimulated with DCs pulsed with AT-2–inactivated HIV-1, and after 24 h [3H]thymidine was added. Cells were harvested after an 18-h incubation. (B) The frequency of IFN-γ–producing cells was determined by enumeration of single IFN-γ–producing cells by ELISPOT, using cells harvested at 24 h after the third stimulation with virus-pulsed DCs. PBLs stimulated with PHA (2 μg/ml) were used as control (CTR). (C) Evaluation of IL-4 and IFN-γ production in the supernatants of primary cultures stimulated three times with autologous DCs. Supernatants from the cell samples described in A were tested for cytokine production by ELISAs.
Figure 7
Potent in vivo primary antibody response to HIV-1 in hu-PBL-SCID mice immunized with autologous DCs generated in the presence of CIFN/GM-CSF and pulsed with inactivated HIV-1. (A) Human anti–HIV-1/gp41 antibodies (total Ig) in sera from hu-PBL-SCID mice immunized and boosted (7 d later) with 1.5 × 10⁶ DCs pulsed (2 h at 37°C) with AT-2–inactivated HIV-1. Each bar represents the mean of values obtained in two distinct experiments (eight mice in total). CTR, sera from mice reconstituted with hu-PBLs and injected with DCs generated in the presence of IFN/GM-CSF, not pulsed with HIV-1. (B) Characterization of the Ig isotype of anti-gp41 antibodies in sera from immunized and control hu-PBL-SCID mice. (C) Western blot analysis of antibodies against HIV-1 proteins using pooled sera from immunized hu-PBL-SCID mice. Sera from three mice for each group were pooled. Results from two different experiments (Exp.) are shown. Western blot analysis was performed as described in Materials and Methods. CTR(−), sera from mice reconstituted with hu-PBLs and injected with DCs generated in the presence of IFN/GM-CSF, not pulsed with HIV-1; CTR(+), positive human serum.
Similar articles
- Monocyte-derived dendritic cells generated after a short-term culture with IFN-alpha and granulocyte-macrophage colony-stimulating factor stimulate a potent Epstein-Barr virus-specific CD8+ T cell response.
Santodonato L, D'Agostino G, Nisini R, Mariotti S, Monque DM, Spada M, Lattanzi L, Perrone MP, Andreotti M, Belardelli F, Ferrantini M. Santodonato L, et al. J Immunol. 2003 May 15;170(10):5195-202. doi: 10.4049/jimmunol.170.10.5195. J Immunol. 2003. PMID: 12734367 - Expression of CCR-7, MIP-3beta, and Th-1 chemokines in type I IFN-induced monocyte-derived dendritic cells: importance for the rapid acquisition of potent migratory and functional activities.
Parlato S, Santini SM, Lapenta C, Di Pucchio T, Logozzi M, Spada M, Giammarioli AM, Malorni W, Fais S, Belardelli F. Parlato S, et al. Blood. 2001 Nov 15;98(10):3022-9. doi: 10.1182/blood.v98.10.3022. Blood. 2001. PMID: 11698286 - IFN-alpha promotes the rapid differentiation of monocytes from patients with chronic myeloid leukemia into activated dendritic cells tuned to undergo full maturation after LPS treatment.
Gabriele L, Borghi P, Rozera C, Sestili P, Andreotti M, Guarini A, Montefusco E, Foà R, Belardelli F. Gabriele L, et al. Blood. 2004 Feb 1;103(3):980-7. doi: 10.1182/blood-2003-03-0981. Epub 2003 Oct 2. Blood. 2004. PMID: 14525781 - Interferon-α in the generation of monocyte-derived dendritic cells: recent advances and implications for dermatology.
Farkas A, Kemény L. Farkas A, et al. Br J Dermatol. 2011 Aug;165(2):247-54. doi: 10.1111/j.1365-2133.2011.10301.x. Epub 2011 Jun 2. Br J Dermatol. 2011. PMID: 21410666 Review. - Adjuvant activity of type I interferons.
Tovey MG, Lallemand C, Thyphronitis G. Tovey MG, et al. Biol Chem. 2008 May;389(5):541-5. doi: 10.1515/bc.2008.051. Biol Chem. 2008. PMID: 18953720 Review.
Cited by
- Optimizing dendritic cell-based immunotherapy: tackling the complexity of different arms of the immune system.
Van Brussel I, Berneman ZN, Cools N. Van Brussel I, et al. Mediators Inflamm. 2012;2012:690643. doi: 10.1155/2012/690643. Epub 2012 Jul 18. Mediators Inflamm. 2012. PMID: 22851815 Free PMC article. Review. - Differential activity of type I interferon subtypes for dendritic cell differentiation.
Garcin G, Bordat Y, Chuchana P, Monneron D, Law HK, Piehler J, Uzé G. Garcin G, et al. PLoS One. 2013;8(3):e58465. doi: 10.1371/journal.pone.0058465. Epub 2013 Mar 5. PLoS One. 2013. PMID: 23472200 Free PMC article. - Regulation of antiviral T cell responses by type I interferons.
Crouse J, Kalinke U, Oxenius A. Crouse J, et al. Nat Rev Immunol. 2015 Apr;15(4):231-42. doi: 10.1038/nri3806. Epub 2015 Mar 20. Nat Rev Immunol. 2015. PMID: 25790790 Review. - MODULATING CO-STIMULATION DURING ANTIGEN PRESENTATION TO ENHANCE CANCER IMMUNOTHERAPY.
Liechtenstein T, Dufait I, Lanna A, Breckpot K, Escors D. Liechtenstein T, et al. Immunol Endocr Metab Agents Med Chem. 2012 Sep;12(3):224-235. doi: 10.2174/187152212802001875. Immunol Endocr Metab Agents Med Chem. 2012. PMID: 22945252 Free PMC article. - Immune Dysfunctions and Immunotherapy in Colorectal Cancer: The Role of Dendritic Cells.
Gessani S, Belardelli F. Gessani S, et al. Cancers (Basel). 2019 Oct 3;11(10):1491. doi: 10.3390/cancers11101491. Cancers (Basel). 2019. PMID: 31623355 Free PMC article. Review.
References
- Steinman R.M. The dendritic cell system and its role in immunogenicity. Annu. Rev. Immunol. 1991;9:271–296. - PubMed
- Cella M., Sallusto F., Lanzavecchia A. Origin, maturation, and antigen-presenting function of dendritic cells. Curr. Opin. Immunol. 1997;9:10–16. - PubMed
- Banchereau J., Steinman R.M. Dendritic cells and the control of immunity. Nature. 1998;392:245–252. - PubMed
- Randolph G.J., Beaulieu S., Lebecque S., Steinman R.M., Muller W.A. Differentiation of monocytes into dendritic cells in a model of transendothelial trafficking. Science. 1998;282:480–483. - PubMed
Publication types
MeSH terms
Substances
LinkOut - more resources
Full Text Sources
Other Literature Sources


