Operons in Escherichia coli: genomic analyses and predictions - PubMed (original) (raw)
Operons in Escherichia coli: genomic analyses and predictions
H Salgado et al. Proc Natl Acad Sci U S A. 2000.
Abstract
The rich knowledge of operon organization in Escherichia coli, together with the completed chromosomal sequence of this bacterium, enabled us to perform an analysis of distances between genes and of functional relationships of adjacent genes in the same operon, as opposed to adjacent genes in different transcription units. We measured and demonstrated the expected tendencies of genes within operons to have much shorter intergenic distances than genes at the borders of transcription units. A clear peak at short distances between genes in the same operon contrasts with a flat frequency distribution of genes at the borders of transcription units. Also, genes in the same operon tend to have the same physiological functional class. The results of these analyses were used to implement a method to predict the genomic organization of genes into transcription units. The method has a maximum accuracy of 88% correct identification of pairs of adjacent genes to be in an operon, or at the borders of transcription units, and correctly identifies around 75% of the known transcription units when used to predict the transcription unit organization of the E. coli genome. Based on the frequency distance distributions, we estimated a total of 630 to 700 operons in E. coli. This step opens the possibility of predicting operon organization in other bacteria whose genome sequences have been finished.
Figures
Figure 1
Size distribution, in number of genes contained, of transcription units in RegulonDB, and size distribution of directons in the M54 version of the E. coli genome.
Figure 2
Frequency distance distributions of pairs of adjacent genes in operons versus those of pairs of adjacent genes at the boundaries between transcription units (t.u.). There are clear differences between both distributions, with genes in operons having peaks very near to distance 0. The highest peaks correspond to the −4 and −1 overlaps.
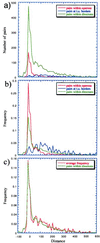
Figure 3
Data used to estimate the total number of operons in the entire E. coli genome. (a) Distance distributions at 10-bp intervals. (b) Frequency distance distributions. (c) Frequency distance distributions of adjacent genes in directons versus the average of those in operons and at transcription unit (t.u.) boundaries. Notice the nice correspondence of the peaks in c, which also confirms how well the sample (operons and transcription unit borders) represents the population (directons, or total adjacent genes transcribed in the same direction). The estimated total operons, as extrapolated from these data, goes from 630 to 700.
Figure 4
Frequency distance distributions as obtained by adding the frequencies at 10-bp intervals, and the log-likelihoods for a pair of genes to be in an operon at each distance interval.
Figure 5
Discrimination of known pairs of genes in operons by the use of distance log-likelihoods alone (dllh), and of distance and functional class log-likelihoods (tllh), at different thresholds. (a) Fraction of right and wrong positives at different thresholds. (b) Sensitivity (right pairs in operons detected/total pairs in operons), specificity (right pairs at borders/total pairs at borders), and accuracy (average of sensitivity and specificity) at different thresholds. The correct identifications are slightly better when functional classes are used.
Figure 6
Size distribution of known and predicted transcription units. As expected, the number of transcription units diminishes with their size in genes in a Poisson distribution style.
Similar articles
- Spatial features for Escherichia coli genome organization.
Xie T, Fu LY, Yang QY, Xiong H, Xu H, Ma BG, Zhang HY. Xie T, et al. BMC Genomics. 2015 Feb 5;16(1):37. doi: 10.1186/s12864-015-1258-1. BMC Genomics. 2015. PMID: 25652224 Free PMC article. - Unprecedented high-resolution view of bacterial operon architecture revealed by RNA sequencing.
Conway T, Creecy JP, Maddox SM, Grissom JE, Conkle TL, Shadid TM, Teramoto J, San Miguel P, Shimada T, Ishihama A, Mori H, Wanner BL. Conway T, et al. mBio. 2014 Jul 8;5(4):e01442-14. doi: 10.1128/mBio.01442-14. mBio. 2014. PMID: 25006232 Free PMC article. - A computational system for identifying operons based on RNA-seq data.
Tjaden B. Tjaden B. Methods. 2020 Apr 1;176:62-70. doi: 10.1016/j.ymeth.2019.03.026. Epub 2019 Apr 4. Methods. 2020. PMID: 30953757 Free PMC article. Review. - Consensus architecture of promoters and transcription units in Escherichia coli: design principles for synthetic biology.
Rangel-Chavez C, Galan-Vasquez E, Martinez-Antonio A. Rangel-Chavez C, et al. Mol Biosyst. 2017 Mar 28;13(4):665-676. doi: 10.1039/c6mb00789a. Mol Biosyst. 2017. PMID: 28256660 Review.
Cited by
- An empirical strategy to detect bacterial transcript structure from directional RNA-seq transcriptome data.
Wang Y, MacKenzie KD, White AP. Wang Y, et al. BMC Genomics. 2015 May 7;16(1):359. doi: 10.1186/s12864-015-1555-8. BMC Genomics. 2015. PMID: 25947005 Free PMC article. - Investigating Evolutionary Dynamics of RHA1 Operons.
Chen Y, Geng D, Ehrhardt K, Zhang S. Chen Y, et al. Evol Bioinform Online. 2016 Jun 28;12:157-63. doi: 10.4137/EBO.S39753. eCollection 2016. Evol Bioinform Online. 2016. PMID: 27398020 Free PMC article. - Chlamydial type III secretion system is encoded on ten operons preceded by sigma 70-like promoter elements.
Hefty PS, Stephens RS. Hefty PS, et al. J Bacteriol. 2007 Jan;189(1):198-206. doi: 10.1128/JB.01034-06. Epub 2006 Oct 20. J Bacteriol. 2007. PMID: 17056752 Free PMC article. - Operon prediction for sequenced bacterial genomes without experimental information.
Bergman NH, Passalacqua KD, Hanna PC, Qin ZS. Bergman NH, et al. Appl Environ Microbiol. 2007 Feb;73(3):846-54. doi: 10.1128/AEM.01686-06. Epub 2006 Nov 22. Appl Environ Microbiol. 2007. PMID: 17122389 Free PMC article. - The evolution of DNA regulatory regions for proteo-gamma bacteria by interspecies comparisons.
Rajewsky N, Socci ND, Zapotocky M, Siggia ED. Rajewsky N, et al. Genome Res. 2002 Feb;12(2):298-308. doi: 10.1101/gr.207502. Genome Res. 2002. PMID: 11827949 Free PMC article.
References
- Dandekar T, Snel B, Huynen M, Bork P. Trends Biochem Sci. 1998;23:324–328. - PubMed
- Lawrence J G. Trends Microbiol. 1997;5:355–359. - PubMed
- Glansdorff N. J Mol Evol. 1999;49:432–438. - PubMed
Publication types
MeSH terms
LinkOut - more resources
Full Text Sources
Other Literature Sources


