Bcl-2 decreases the free Ca2+ concentration within the endoplasmic reticulum - PubMed (original) (raw)
Bcl-2 decreases the free Ca2+ concentration within the endoplasmic reticulum
R Foyouzi-Youssefi et al. Proc Natl Acad Sci U S A. 2000.
Abstract
The antiapoptotic protein Bcl-2 localizes not only to mitochondria but also to the endoplasmic reticulum (ER). However, the function of Bcl-2 at the level of the ER is poorly understood. In this study, we have investigated the effects of Bcl-2 expression on Ca(2+) storage and release by the ER. The expression of Bcl-2 decreased the amount of Ca(2+) that could be released from intracellular stores, regardless of the mode of store depletion, the cell type, or the species from which Bcl-2 was derived. Bcl-2 also decreased cellular Ca(2+) store content in the presence of mitochondrial inhibitors, suggesting that its effects were not mediated through mitochondrial Ca(2+) uptake. Direct measurements with ER-targeted Ca(2+)-sensitive fluorescent "cameleon" proteins revealed that Bcl-2 decreased the free Ca(2+) concentration within the lumen of the ER, [Ca(2+)](ER). Analysis of the kinetics of Ca(2+) store depletion in response to the Ca(2+)-ATPase inhibitor thapsigargin revealed that Bcl-2 increased the permeability of the ER membrane. These results suggest that Bcl-2 decreases the free Ca(2+) concentration within the ER lumen by increasing the Ca(2+) permeability of the ER membrane. The increased ER Ca(2+) permeability conferred by Bcl-2 would be compatible with an ion channel function of Bcl-2 at the level of the ER membrane.
Figures
Figure 1
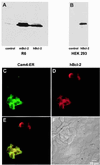
Western blot and immunofluorescence analysis of Bcl-2 expression in transfected cells. Western blot of control, mBcl-2, and hBcl-2-expressing R6 rat embryo fibroblasts (A) or HEK-293 cells (B). (C–F) Fluorescence imaging analysis of Bcl-2 expression in HEK-293 cells, transiently cotransfected with the hBcl-2 (or control vector) and with ER-targeted cameleon (Cam4-ER). (C) Cam4-ER fluorescence. (D) Bcl-2 immunofluorescence. (E) Pseudocolored and merged images of the cells (yellow = colocalization). (F) Differential interference contrast Nomarski image of the cells.
Figure 2
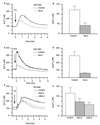
Bcl-2 reduces the amount of releasable Ca2+ from intracellular stores. (A) [Ca2+]c trace in control and Bcl-2-expressing A20 cells in response to 100 nM TG. (B) Peak [Ca2+]c increase in response to 100 nM TG in control and Bcl-2-expressing A20 cells. (C) [Ca2+]c trace in control and Bcl-2-expressing A20 cells in response to 100 nM ionomycin. (D) Peak [Ca2+]c increase in response to 100 nM ionomycin in control and Bcl-2-expressing A20 cells. (E) [Ca2+]c traces in control R6 cells and R6 cells expressing hBcl-2 or mBcl-2, in response to 100 nM TG. (F) Peak Ca2+ increase in response to 100 nM TG in control R6 cells and R6 cells expressing hBcl-2 or mBcl-2 (the initial short-lasting upstroke seen in R6-hBcl-2 cells is pipetting artifact). Data shown in B, D, and F are mean ± SEM from four independent experiments.
Figure 3
Bcl-2 reduces the free Ca2+ concentration within the ER. (A) Measurements using ER-targeted cameleon. (Upper) Single wavelength cameleon fluorescence (emission 535 nm) of control and hBcl-2-expressing HEK-293 cells, showing the reticular pattern typical of the ER. (Lower) Corresponding emission ratio images of the same cells (535/475 nm), thresholded to extract the region of interest that were spatially averaged to yield [Ca2+]ER values. (B) Time course of spatially averaged Cam4-ER ratio fluorescence in control R6 cells, and R6 cells expressing hBcl-2 or mBcl-2. Cells were incubated in Ca2+-free medium and stimulated with TG (1 μM) and ionomycin (iono) (1 μM) to completely deplete intracellular Ca2+ stores. The calibration procedure systematically performed at the end of each experiment is shown to illustrate the dynamic range (_R_max/_R_min) of the probe. (C) Basal [Ca2+]ER values (mean ± SEM) in control R6 cells versus hBcl-2 and mBcl-2 stable transfectants, as well as in control and Bcl-2-transfected HEK-293 cells. Measurements of [Ca2+]ER were made 3–4 days after transfection with Cam4-ER (R6 cells) or Cam4-ER plus Bcl-2 or control vector (HEK-293 cells). Results are derived from three independent experiments. *, P < 0.05; **, P < 0.0002.
Figure 4
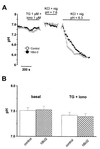
Bcl-2 overexpression does not affect the pH of the ER. ER pH was measured by directly exciting at 480 nm the pH-dependent EYFP contained within the cameleon probe and measuring its fluorescence emission at 535 nm. HEK-293 cells cotransfected with Cam4-ER and hBcl-2 or control vector were used. (A) Time-course experiment showing the effect of TG and ionomycin (iono) on ER pH and the subsequent calibration with 130 mM KCl + 10 μM nigericin (nig) at pH 7.6 and 6.3. (B) pH values measured in the ER of control and hBcl-2 overexpressing cells, in basal condition and after store depletion with TG (1 μM) and ionomycin (1 μM). Data are mean ± SEM (n = 5) from two independent experiments in each condition.
Figure 5
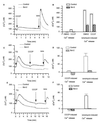
Mitochondria and TG-insensitive Ca2+ pools in Bcl-2-expressing cells. (A) Typical [Ca2+]c traces of cells sequentially exposed to the mitochondrial inhibitor CCCP (1 μM) followed by ionomycin (iono) (100 nM). (B) Peak [Ca2+]c after addition of CCCP or solvent control (left bars) and after subsequent addition of ionomycin (right bars); mean ± SEM of three independent experiments. (C and E) Typical [Ca2+]c trace in cells sequentially exposed to TG (100 nM) for 0 min, CCCP (1 μM) for 5 min or 10 min, and ionomycin (100 nM) at 10 min or 15 min. (D and F) Peak [Ca2+]c after addition of CCCP (left bars) and after subsequent addition of ionomycin (right bars) to cells previously exposed to TG at t = 0. The time between TG and ionomycin addition was 5 min or 10 min for D and F, respectively.
Figure 6
Bcl-2 increases the permeability of ER-type Ca2+ stores. TG (100 nM) was added at time 0 min, and ionomycin (iono; 10 μM) was added either concomitantly with TG, or at later time points (1 min, 2 min, 3 min, 4, min, 5 min). (A and B) Typical experiments showing [Ca2+]c elevations in control and Bcl-2-transfected cells, respectively; four traces with ionomycin addition at different time points are superimposed to facilitate comparison. (C) Ionomycin-releasable Ca2+ (expressed as % of the initial peak [Ca2+]c) is plotted as a function of time after TG addition. (D) Time constant (τ) of Ca2+ store depletion, calculated for control and Bcl-2-transfected cells by fitting a mono-exponential decay function to the data of C. Results shown in C and D are mean ± SEM of four independent experiments.
Figure 7
Bcl-2 increases unstimulated Ca2+ influx and basal [Ca2+]c. (A and B) Cells were suspended in a Ca2+-free medium, and 1 mM Ca2+ was added to the medium after 5-min baseline recording. (A) Typical experiments showing [Ca2+]c elevations in control and Bcl-2-transfected cells without cellular stimulation. (B) Typical experiments showing [Ca2+]c elevations in control and Bcl-2-transfected cells after TG stimulation. (C) Basal [Ca2+]c of cells maintained in Ca2+-free medium or in Ca2+-containing medium; mean ± SEM of four independent experiments. (D) Statistical analysis of experiments as shown in A. (E) Statistical analysis of experiments as shown in B.
Similar articles
- Evidence that BCL-2 represses apoptosis by regulating endoplasmic reticulum-associated Ca2+ fluxes.
Lam M, Dubyak G, Chen L, Nuñez G, Miesfeld RL, Distelhorst CW. Lam M, et al. Proc Natl Acad Sci U S A. 1994 Jul 5;91(14):6569-73. doi: 10.1073/pnas.91.14.6569. Proc Natl Acad Sci U S A. 1994. PMID: 8022822 Free PMC article. - Bcl-2 modulates endoplasmic reticulum and mitochondrial calcium stores in PC12 cells.
Hirata H, Lopes GS, Jurkiewicz A, Garcez-do-Carmo L, Smaili SS. Hirata H, et al. Neurochem Res. 2012 Feb;37(2):238-43. doi: 10.1007/s11064-011-0600-5. Epub 2011 Oct 13. Neurochem Res. 2012. PMID: 21993540 - Depletion of intracellular Ca2+ store itself may be a major factor in thapsigargin-induced ER stress and apoptosis in PC12 cells.
Yoshida I, Monji A, Tashiro K, Nakamura K, Inoue R, Kanba S. Yoshida I, et al. Neurochem Int. 2006 Jun;48(8):696-702. doi: 10.1016/j.neuint.2005.12.012. Epub 2006 Feb 14. Neurochem Int. 2006. PMID: 16481070 - Regulation of endoplasmic reticulum Ca2+ dynamics by proapoptotic BCL-2 family members.
Oakes SA, Opferman JT, Pozzan T, Korsmeyer SJ, Scorrano L. Oakes SA, et al. Biochem Pharmacol. 2003 Oct 15;66(8):1335-40. doi: 10.1016/s0006-2952(03)00482-9. Biochem Pharmacol. 2003. PMID: 14555206 Review. - Bcl-2 proteins and calcium signaling: complexity beneath the surface.
Vervliet T, Parys JB, Bultynck G. Vervliet T, et al. Oncogene. 2016 Sep 29;35(39):5079-92. doi: 10.1038/onc.2016.31. Epub 2016 Mar 14. Oncogene. 2016. PMID: 26973249 Review.
Cited by
- Cadmium-induced apoptosis in primary rat cerebral cortical neurons culture is mediated by a calcium signaling pathway.
Yuan Y, Jiang CY, Xu H, Sun Y, Hu FF, Bian JC, Liu XZ, Gu JH, Liu ZP. Yuan Y, et al. PLoS One. 2013 May 31;8(5):e64330. doi: 10.1371/journal.pone.0064330. Print 2013. PLoS One. 2013. PMID: 23741317 Free PMC article. - NCS-1 expression is higher in basal breast cancers and regulates calcium influx and cytotoxic responses to doxorubicin.
Bong AHL, Robitaille M, Milevskiy MJG, Roberts-Thomson SJ, Monteith GR. Bong AHL, et al. Mol Oncol. 2020 Jan;14(1):87-104. doi: 10.1002/1878-0261.12589. Epub 2019 Nov 11. Mol Oncol. 2020. PMID: 31647602 Free PMC article. - Mammalian Bax-induced plant cell death can be down-regulated by overexpression of Arabidopsis Bax Inhibitor-1 (AtBI-1).
Kawai-Yamada M, Jin L, Yoshinaga K, Hirata A, Uchimiya H. Kawai-Yamada M, et al. Proc Natl Acad Sci U S A. 2001 Oct 9;98(21):12295-300. doi: 10.1073/pnas.211423998. Epub 2001 Oct 2. Proc Natl Acad Sci U S A. 2001. PMID: 11593047 Free PMC article. - Bcl-2-mediated alterations in endoplasmic reticulum Ca2+ analyzed with an improved genetically encoded fluorescent sensor.
Palmer AE, Jin C, Reed JC, Tsien RY. Palmer AE, et al. Proc Natl Acad Sci U S A. 2004 Dec 14;101(50):17404-9. doi: 10.1073/pnas.0408030101. Epub 2004 Dec 7. Proc Natl Acad Sci U S A. 2004. PMID: 15585581 Free PMC article. - Non-Structural Proteins from Human T-cell Leukemia Virus Type 1 in Cellular Membranes-Mechanisms for Viral Survivability and Proliferation.
Georgieva ER. Georgieva ER. Int J Mol Sci. 2018 Nov 8;19(11):3508. doi: 10.3390/ijms19113508. Int J Mol Sci. 2018. PMID: 30413005 Free PMC article. Review.
References
- Monaghan P, Robertson D, Amos T A, Dyer M J, Mason D Y, Greaves M F. J Histochem Cytochem. 1992;40:1819–1825. - PubMed
- Jacobson M D, Burne J F, King M P, Miyashita T, Reed J C, Raff M C. Nature (London) 1993;361:365–369. - PubMed
- Krajewski S, Tanaka S, Takayama S, Schibler M J, Fenton W, Reed J C. Cancer Res. 1993;53:4701–4714. - PubMed
- Hockenbery D, Nunez G, Milliman C, Schreiber R D, Korsmeyer S J. Nature (London) 1990;348:334–336. - PubMed
Publication types
MeSH terms
Substances
LinkOut - more resources
Full Text Sources
Miscellaneous


