Kinetics of Ca2+ binding to parvalbumin in bovine chromaffin cells: implications for [Ca2+] transients of neuronal dendrites - PubMed (original) (raw)
Kinetics of Ca2+ binding to parvalbumin in bovine chromaffin cells: implications for [Ca2+] transients of neuronal dendrites
S H Lee et al. J Physiol. 2000.
Abstract
kappaS1. The effect of parvalbumin (PV) on [Ca2+] transients was investigated by perfusing adrenal chromaffin cells with fura-2 and fluorescein isothiocyanate (FITC)-labelled PV. As PV diffused into cells, the decay of [Ca2+] transients was transformed from monophasic into biphasic. The proportion of the initial fast decay phase increased in parallel with the fluorescence intensity of FITC, indicating that PV is responsible for the initial fast decay phase. The relationship between the fast decay phase and the [Ca2+] level was investigated using depolarizing trains of stimuli. Within a train the relative amplitude of the fast decay phase was inversely dependent on the [Ca2+] level preceding a given stimulus. Based on these observations, we estimated the Ca2+ binding ratio of PV (kappaP), the apparent dissociation constant of PV for Ca2+ (Kdc, app), and the unbinding rate constant of Ca2+ from PV (kc-) in the cytosol of chromaffin cells. Assuming free [Mg2+] to be 0.14 mM, we obtained values of 51.4 +/- 2.0 nM (n = 3) and 0.95 +/- 0.026 s-1 (n = 3), for Kdc,app and kc-, respectively. With the parameters obtained in the perfusion study, we simulated [Ca2+] transients, using two different Ca2+ extrusion rates (gamma) - 20 and 300 s-1 - which represent typical values for chromaffin cells and neuronal dendrites, respectively. The simulation indicated that Ca2+ is pumped out before it is equilibrated with PV, when gamma is comparable to the equilibration rates between PV and Ca2+, resulting in the fast decay phase of a biexponential [Ca2+] transient. From these results we conclude that Ca2+ buffers with slow kinetics, such as PV, may cause biexponential decays in [Ca2+] transients, thereby complicating the analysis of endogenous Ca2+ binding ratios (kappaS) based on time constants. Nevertheless, estimates of kappaS based on Ca2+ increments provide reasonable estimates for Ca2+ binding ratios before equilibration with PV.
Figures
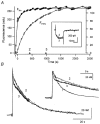
Figure 1. Consecutive patch recording on a chromaffin cell
A first whole cell patch pipette contained 400 μM fura-2; a second one contained 150 μM fura-2 and nominally 100 μM PV. A, plot of fluorescence at the isosbestic wavelength (_F_fura2, left ordinate) and that at 488 nm (_F_FITC, right ordinate) against the whole cell patch recording time. The first whole cell patch was maintained for 67 s. After that, the second whole cell recording was obtained at 0 s. Fura-2 and FITC diffused into the cell via the second whole cell patch pipette with time constants of 190 and 595 s, respectively. Calcium currents recorded at times ‘2′ and ‘3′ are shown in the inset. B, two [Ca2+] transients obtained at times ‘2′ (313 s) and ‘3′ (965 s) marked in A. The intracellular fura-2 concentrations at ‘2′ and ‘3′ in A were calculated from the fura-2 loading curve to be 142 and 150 μM, respectively. In the same way, nominal PV concentrations at ‘2′ and ‘3′ were calculated as 46.8 and 80.2 μM, respectively. In the inset, the same [Ca2+] transients are shown on an expanded time scale. For comparison, the [Ca2+] transient obtained in the first patch experiment in the absence of PV (at −57 s; marked with ‘1′ in A) is also shown in the inset. The vertical scale bar in the inset represents 127.5 nM for the [Ca2+] transient ‘1′, and 20 nM for ‘2′ and ‘3′.
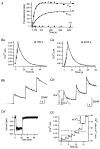
Figure 2. Parvalbumin loaded into adrenal chromaffin cells
A, loading curve of fura-2 and FITC-PV. The quantities _F_iso and _F_488 (see Methods) were plotted against time (s) elapsed after break-in. The loading curves were fitted with monoexponential curves (continuous lines) with τfura = 106.4 s for _F_iso and τFITC = 372.3 s for _F_488. ▴, times when bursts of depolarizing pulses were given. In addition, the times when the Ca2+ traces displayed in Ba and Ca were recorded are marked. Ba, [Ca2+] transients evoked at 100 s after break-in. Bb, the [Ca2+] trace between 0 s (the time when the 1st pulse of this burst was given) and 7 s is depicted on an expanded time scale. Ca, [Ca2+] transients evoked by a train of 8 pulses given at 2070 s after break-in. Cb and c, [Ca2+] transients in the interval of 0 and 7 s (b) and those between −1 and 18 s (c) are re-displayed on an expanded time scale. Examples used for the estimation of various kinds of [Ca2+] increments (as defined in the text) are illustrated in Cb and c. The amount of calcium influx during pulses as calculated from Ca2+ current traces (Cd) is included in Cc (×, right axis).
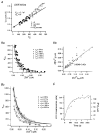
Figure 3. Analysis of data presented in Fig. 2
A, plot of the ratios between total amounts of Ca2+ influx (Q_υ/2_F) and peak amplitudes of [Ca2+] transients (d[Ca2+]p,υ) as a function of κB‘. Only the ratios measured from those [Ca2+] transients which lacked a fast drop phase (•) were used for the fit (continuous line). Accessible cell volume and κS were calculated from the slope ( = 1.1 pl) and the _x_-axis intercept ( = 87) of the regression line, respectively. Ba, plot of κP′ estimated from eqn (18) against [Ca2+]rest (the [Ca2+] before a given pulse, open symbols) and [Ca2+]peak (filled symbols). Values from fourth to eighth bursts are superimposed. Bb, plot of d[Ca2+]e as a function of [Ca2+]rest. d[Ca2+]e was fitted by 0.42[Ca2+]rest+ 0.0048 (μM). Bc, plot of κP′ estimated from eqn (18) as a function of [Ca2+]rest. Values for κP′ from different bursts are represented by different symbols. Dotted curves represent fits to values from a given burst. Parameters for the fits, [PV]T, are displayed in panel C. The continuous curve in Bc is the fit for κP′ obtained by pooling values from the last 3 bursts. C, plot of _F_FITC (dotted line, left axis) and [PV]T (○, right axis) estimated in panel Bc against loading time.
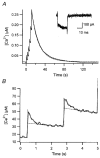
Figure 4. Example for the measurement of kinetic parameters of Ca2+ binding to PV
A, composite [Ca2+] transient evoked by 6 successive depolarizing pulses, the 1st one of which was given at 570 s after break-in in the experiment of Fig. 2. Ca2+ currents in response to all depolarizing pulses are superimposed in the inset. B, individual [Ca2+] transients in response to the first 2 pulses are depicted on an expanded time scale. Kinetic properties of PV were calculated from this trace using eqn (9), as follows. The fast drop phase in the 1st transient (B) was fitted with an exponential with a rate constant of 2.86 s−1. The time integral of the whole [Ca2+] transient evoked by the train of 6 pulses was 5.35 μM s and the sum of Ca2+ influxes during the burst measured from 6 calcium current traces (as shown in the inset of A) was 0.15 fmol. Thus, the Ca2+ extrusion rate (γ) was calculated to be 25.25 s−1 according to eqn (20), together with d[Ca]T = 0.136 mM (= 0.15 fmol (1.1pl)−1, when the cellular volume was taken from the estimate of Fig. 3_A_). The total concentration of parvalbumin ([PV]T) had already been estimated in Fig. 3_B_ and C as 63.5 μM. From this, [PV]free was calculated as 7.68 μM using the definition of κP‘, eqn (12), and assuming that [Mg2+] = 0.14 mM, _K_dm = 31 μM (Eberhard & Erne, 1994). Furthermore, the Σκ was calculated as 608 from κS = 87 and κB′ = 521 which, in turn, was based on the following values: [B]T = 150 μM and _K_d (fura2-Ca) = 210 nM. Finally, using eqn (9) and the relationship _K_dc =_k_off/_k_on = 9.2 nM, _k_on and _k_off could be calculated to be 107.5 μM−1 s−1 and 0.98 s−1.
Figure 5. Numerical simulation of [Ca2+] transients
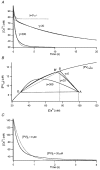
A, the results from numerical integration of eqn (22) with the following parameters: [Ca2+]rest = 30 nM, [Mg2+] = 150 μM, d[Ca]T = 14 μM, [PV]T = 20 μM, _k_c- = 1 s−1, _k_m- = 25 s−1, _K_dc = 10 nM, _K_dm = 50 μM, and Σκ = 200. A time interval of d t = 5 ms was used for the integration. The two [Ca2+] transients whose γ values are 20 and 300 s−1 are well described by double exponential curves:
Least square fits of the simulation results gave the following parameters: _w_1 = 43 nM, λ1 = 3.64 s−1, _w_2 = 25 nM, λ2 = 0.74 s−1 for the high-γ curve; _w_1 = 22.8 nM, λ1 = 3.08 s−1, _w_2 = 44.9 nM, λ2 = 0.067 s−1 for the low-γ curve. The equilibrated amplitude d[Ca2+]e was estimated by back-extrapolation of a straight line fitted to the section of the transient between 1.4 and 2 s. The theoretical expectation for the kinetic parameters for the low-γ curve was λ1 < 3.28 s−1, λ2 = 0.067 s−1 according to eqns (9) and (10), respectively. A simulation result with γ = 0 s−1 is superimposed onto the traces for comparison (dotted curve). B, plot of the same simulation results in the [PVCa]-[Ca2+] plane. The _x_-value of point B is the [Ca2+] level reached when Ca2+ is equilibrated with PV for γ = 0 s−1. This corresponds quite well to the value for d[Ca2+]e obtained in A of this figure. C, simulated [Ca2+] transients with and without PV in a neuronal dendrite. PV accelerates the [Ca2+] decay at early times, whereas it slows down the final clearance of residual Ca2+. Parameters used for this simulation were the same as those of the high-γ curve in A except for Σκ which was 120.
Figure 7. Simulated [Ca2+] transient responses
10 Hz stimulation with a Ca2+ influx (d[Ca]T) per pulse of 20 μM in the absence (dotted line) and in the presence of 200 μM PV (continuous line) was assumed. Other parameters are the same as those in Fig. 6. The same traces are depicted on an expanded time scale in the inset.
Figure 6. Simulation of a fura-2 loading experiment
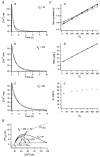
A, [Ca2+] transients obtained by numerical integration with κB′ = 20 (a), κB′ = 200 (b), κB′ = 350 (c). Other parameters are given in the main text. Each transient is fitted with a single exponential (dotted curve). The time constants obtained were 0.44, 1.23 and 1.81 s. B, plot of the three [Ca2+] transients shown in A on the plane of [PVCa]-[Ca2+]. The steady state relationship between [PVCa] and [Ca2+] is also superimposed (dotted curve). C, plot of single exponential fit results, τ (a) and 1/dCa (b) against κB‘. Time integrals of single exponential fits (or _A_τ) are also depicted against κB‘. From the line fit of τ and 1/d[Ca2+]t = 0 against κB‘, estimates for κS(τ) and κS(dCa) were obtained. They were 82 and 135, respectively (continuous line in a and b). When only the latest 3 points of τ were fitted (dashed line), the _x_-axis intercept of the line is κS(τ) = 134. The τ values for simulations with [PV]T = 0 were also plotted in C (○): fitting to these values resulted in the correct κS(τ) of 150.
Similar articles
- Mutational analysis of dendritic Ca2+ kinetics in rodent Purkinje cells: role of parvalbumin and calbindin D28k.
Schmidt H, Stiefel KM, Racay P, Schwaller B, Eilers J. Schmidt H, et al. J Physiol. 2003 Aug 15;551(Pt 1):13-32. doi: 10.1113/jphysiol.2002.035824. Epub 2003 Jun 17. J Physiol. 2003. PMID: 12813159 Free PMC article. - Differences in Ca2+ buffering properties between excitatory and inhibitory hippocampal neurons from the rat.
Lee SH, Rosenmund C, Schwaller B, Neher E. Lee SH, et al. J Physiol. 2000 Jun 1;525 Pt 2(Pt 2):405-18. doi: 10.1111/j.1469-7793.2000.t01-3-00405.x. J Physiol. 2000. PMID: 10835043 Free PMC article. - Decay of calcium transients after electrical stimulation in rat fast- and slow-twitch skeletal muscle fibres.
Carroll SL, Klein MG, Schneider MF. Carroll SL, et al. J Physiol. 1997 Jun 15;501 ( Pt 3)(Pt 3):573-88. doi: 10.1111/j.1469-7793.1997.573bm.x. J Physiol. 1997. PMID: 9218218 Free PMC article. - The use of transgenic mouse models to reveal the functions of Ca2+ buffer proteins in excitable cells.
Schwaller B. Schwaller B. Biochim Biophys Acta. 2012 Aug;1820(8):1294-303. doi: 10.1016/j.bbagen.2011.11.008. Epub 2011 Nov 27. Biochim Biophys Acta. 2012. PMID: 22138448 Review.
Cited by
- Developmental dynamics of the prefrontal cortical SST and PV interneuron networks: Insights from the monkey highlight human-specific features.
Fin NSH, Yip A, Teo L, Homman-Ludiye J, Bourne JA. Fin NSH, et al. bioRxiv [Preprint]. 2024 Jul 15:2024.07.10.602904. doi: 10.1101/2024.07.10.602904. bioRxiv. 2024. PMID: 39026896 Free PMC article. Preprint. - Three functional facets of calbindin D-28k.
Schmidt H. Schmidt H. Front Mol Neurosci. 2012 Mar 15;5:25. doi: 10.3389/fnmol.2012.00025. eCollection 2012. Front Mol Neurosci. 2012. PMID: 22435048 Free PMC article. - Parvalbumin is a mobile presynaptic Ca2+ buffer in the calyx of Held that accelerates the decay of Ca2+ and short-term facilitation.
Müller M, Felmy F, Schwaller B, Schneggenburger R. Müller M, et al. J Neurosci. 2007 Feb 28;27(9):2261-71. doi: 10.1523/JNEUROSCI.5582-06.2007. J Neurosci. 2007. PMID: 17329423 Free PMC article. - Spino-dendritic cross-talk in rodent Purkinje neurons mediated by endogenous Ca2+-binding proteins.
Schmidt H, Kunerth S, Wilms C, Strotmann R, Eilers J. Schmidt H, et al. J Physiol. 2007 Jun 1;581(Pt 2):619-29. doi: 10.1113/jphysiol.2007.127860. Epub 2007 Mar 8. J Physiol. 2007. PMID: 17347272 Free PMC article. - IQ-motif proteins influence intracellular free Ca2+ in hippocampal neurons through their interactions with calmodulin.
Kubota Y, Putkey JA, Shouval HZ, Waxham MN. Kubota Y, et al. J Neurophysiol. 2008 Jan;99(1):264-76. doi: 10.1152/jn.00876.2007. Epub 2007 Oct 24. J Neurophysiol. 2008. PMID: 17959737 Free PMC article.
References
- Celio MR. Parvalbumin in most γ-aminobutyric acid-containing neurons of the rat cerebral cortex. Science. 1986;231:995–997. - PubMed
- Celio MR. Calbindin D-28k and parvalbumin in the rat nervous system. Neuroscience. 1990;35:375–475. - PubMed
Publication types
MeSH terms
Substances
LinkOut - more resources
Full Text Sources
Research Materials
Miscellaneous
