Distribution and activation of voltage-gated potassium channels in cell-attached and outside-out patches from large layer 5 cortical pyramidal neurons of the rat - PubMed (original) (raw)
Distribution and activation of voltage-gated potassium channels in cell-attached and outside-out patches from large layer 5 cortical pyramidal neurons of the rat
J M Bekkers. J Physiol. 2000.
Abstract
Voltage-gated potassium channels were studied in cell-attached and outside-out patches from the soma and primary apical dendrite of large layer 5 pyramidal neurons in acute slices of rat sensorimotor cortex (22-25 degrees C). Ensemble averages revealed that some patches contained only fast, I(A)-like channels, other contained only I(K)-like channels that did not inactivate or inactivated slowly, and the remainder contained mixtures of both types. I(A) and I(K) channels had mean unitary conductances of 8.5 and 20.3 pS, respectively, and had distinctive patterns of gating. Peak activation curves for ensemble-averaged currents were described by the Boltzmann equation with half-maximal voltage [V(1/2)] and slope factor (k) values of -24.5 mV and 16.9 mV for I(A) and -7.6 mV and 10.1 mV for I(K) (patches < 250 microm from the soma) or -22.9 mV and 16.2 mV for I(A) (patches > 250 microm from the soma). The steady-state inactivation curve for I(A) gave V(1/2) and k values of -72.3 mV and -5.9 mV (< 250 microm from the soma) or -83.1 mV and -6.5 mV (> 250 microm from the soma). These values were similar to the corresponding data for I(A) and I(K) in nucleated patches from the same cell. The amount of I(A) and I(K) present in patches depended weakly on distance along the primary apical dendrite from the soma. The amplitude of I(A) increased, on the average, by 2.3 pA per 100 microm, while the amplitude of I(K) decreased by 0.4 pA per 100 microm. I(A) and I(K) channels in dendritic cell-attached patches were activated by the passage of a back-propagating action potential past the tip of the patch electrode. These results show directly that these potassium channels participate in action potential repolarisation, and thus contribute to the process of synaptic integration in these neurons.
Figures
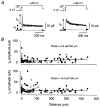
Figure 6. Distribution of _I_A and _I_K channels along the primary apical dendrite
A, potassium currents in two different patches, showing how _I_A and _I_K were assayed. Currents were measured with and without a 50 ms prepulse to -37 mV to inactivate _I_A, if present. In most patches _I_A and _I_K were kinetically distinct (e.g. left traces) and their amplitudes were estimated by fitting the sum of two exponentials to the decaying phase of the current measured without the -37 mV prepulse (larger current, left). In patches containing only _I_A or _I_K (e.g. right traces, showing only _I_K) the current was measured from the peak response without the -37 mV prepulse (larger current, right). The patches shown here were obtained 260 μm (left; outside-out configuration) and 75 μm (right; cell-attached configuration) from the soma. Each trace is an average of 20 episodes. B, plots of peak _I_A (top) and peak _I_K (bottom) versus distance from the soma. Each circle represents the current recorded in a different patch, either in cell-attached (○, mostly overlapping at the soma; _n_= 73) or outside-out configuration (•; _n_= 55). The superimposed fits are given by _I_= 0.023 _d_+ 4.7 (_I_A) and _I_=−0.004 _d_+ 13.0 (_I_K) where I is the current in pA and d is distance in μm.
Figure 4. Peak activation data for _I_A and _I_K
A, activation family for a cell-attached somatic patch containing pure _I_A. Following a 300 ms prepulse to -127 mV, the membrane potential was stepped to a test potential ranging from -47 to +53 mV in 20 mV increments. Each trace is an average of 10 episodes. Linear leak and capacitance currents have been subtracted. B, averaged, normalised peak activation plot for _I_A, measured in patches on the soma or on the primary apical dendrite <250 μm from the soma (•; _n_= 10) or >250 μm from the soma (○; _n_= 4). Error bars are ±
s.e.m.
The superimposed continuous curves are Boltzmann functions with the indicated fit parameters. The dashed curve is the Boltzmann fit to I_A activation data measured in nucleated patches in TEA from the same cell type (Fig. 7_C, Bekkers, 2000). C, activation family for a cell-attached dendritic patch (90 μm from the soma) containing a pure _I_K-like current. Recording conditions were identical to those in A, except that each trace is an average of 20 episodes. D, averaged, normalised peak activation plot for both inactivating and non-inactivating variants of _I_K-like current <250 μm from the soma (_n_= 26). The continuous curve is the Boltzmann function with the indicated fit parameters; the dashed curve is the fit for I_K activation in nucleated patches in 4-AP (Fig. 7_F, Bekkers, 2000).
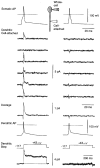
Figure 7. Back-propagating action potentials activate voltage-gated dendritic potassium channels
Each column shows data from a different neuron. The inset (top) shows schematically the recording configuration. A 5 ms-long 400 pA current step was injected at the soma, evoking an action potential (Somatic AP; horizontal dashed line is 0 mV). A cell-attached patch electrode on the primary apical dendrite 100 μm (left) or 135 μm (right) from the soma was used to record single potassium channels activated by the passage of the back-propagating action potential (Dendritic Cell-attached). Typical consecutive trials are shown. The interior of this dendritic electrode, which contained Hepes-buffered external solution plus 0.5 μM TTX, was voltage clamped at 0 mV. A capacitance artefact, due to the passage of the action potential past the tip of the dendritic electrode, has been subtracted (see text). Occasional downward spikes are subtraction artefacts resulting from jitter in the timing of the action potentials. Clear channel activity is apparent in the left patch, but not in the right patch. Averages of 99 (left) or 60 (right) trials are shown (Average). The left-hand average has a decay time constant of 1.5 ms. A depolarising voltage step applied to the dendritic patch via the dendritic electrode revealed a mixed _I_A and _I_K current in the left patch, but no channels in the right patch (Dendritic Step). Finally, the membrane under the tip of the dendritic electrode was ruptured in order to measure the action potential at the recording site (Dendritic AP).
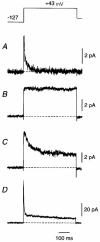
Figure 1. Averaged outward currents in cell-attached somatic patches from large layer 5 cortical pyramidal cells show patch-to-patch kinetic diversity
Following a 300 ms prepulse to -127 mV, the membrane potential was stepped to +43 mV for 500 ms (top). Capacitance transients and linear leak currents have been subtracted using an online subtraction protocol (Methods). A fast _I_A-like current was apparent in some patches, either in isolation (A) or with a slower _I_K-like current (D). In some patches the _I_K-like current inactivated during the test pulse (C) and in other patches it did not (B). All electrodes contained external solution plus 1 μM TTX but no other blockers. Each trace is an average of 10 (A and D), 20 (C) or 40 (B) episodes. Each patch is from a different neuron. Similar diversity was seen in dendritic patches and in outside-out patches.
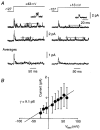
Figure 2. A smaller-conductance channel underlies the _I_A-like current
A, representative single episodes (top two data traces) recorded in a cell-attached somatic patch during a voltage step to two different test potentials (pulse protocol at top). Insets show on an expanded time scale the channel openings immediately below. Horizontal dashed lines indicate the mean open-channel current at each potential. Averages of 10 such episodes are shown at the bottom. Leak and capacitance currents have been subtracted. B, plot of mean single-channel current (±
s.d.
) versus membrane potential for this patch. The
s.d.
was obtained from a Gaussian fit to the amplitude histogram at each potential (Methods). The fitted straight line gave a single-channel conductance (γ) of 9.1 pS. The electrode solution contained 1 μM TTX but no other blockers.
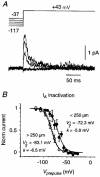
Figure 5. Steady-state inactivation data for _I_A
A, inactivation family for pure _I_A, measured in a cell-attached somatic patch. The prepulse voltage ranged from -117 to -37 mV in 20 mV increments, and its duration was 300 ms. Each trace is an average of 20 episodes. Leak currents have been subtracted. B, averaged, normalised steady-state inactivation plot for _I_A, measured in patches on the soma or on the primary apical dendrite <250 μm from the soma (•; _n_= 8) or >250 μm from the soma (○; _n_= 4). Error bars are ±
s.e.m.
Continuous curves are Boltzmann functions with the indicated fit parameters; the dashed curve is the fit for I_A inactivation in nucleated patches in TEA (Fig. 6_B, Bekkers, 2000).
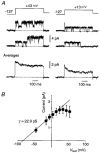
Figure 3. A larger-conductance channel underlies the different inactivation variants of the _I_K-like current
A, representative single episodes (top) and averages (n_= 20; bottom) recorded in a somatic cell-attached patch at two different test potentials (pulse protocol at top). Horizontal dashed lines indicate the closed state. Linear leak and capacitance currents have been subtracted. Similar single-channel properties were seen for the channels underlying both inactivating (Fig. 1_C) and non-inactivating (Fig. 1_B_) variants of the _I_K-like current. B, plot of mean single-channel current (±
s.d.
) versus membrane potential for this patch. Note the inward rectification at more strongly depolarised potentials. The straight line, fitted over the range -50 to +30 mV, gave a single-channel conductance of 22.9 pS. The electrode solution contained 1 μM TTX but no other blockers.
Similar articles
- Voltage-gated K+ channels in layer 5 neocortical pyramidal neurones from young rats: subtypes and gradients.
Korngreen A, Sakmann B. Korngreen A, et al. J Physiol. 2000 Jun 15;525 Pt 3(Pt 3):621-39. doi: 10.1111/j.1469-7793.2000.00621.x. J Physiol. 2000. PMID: 10856117 Free PMC article. - Properties of voltage-gated potassium currents in nucleated patches from large layer 5 cortical pyramidal neurons of the rat.
Bekkers JM. Bekkers JM. J Physiol. 2000 Jun 15;525 Pt 3(Pt 3):593-609. doi: 10.1111/j.1469-7793.2000.t01-1-00593.x. J Physiol. 2000. PMID: 10856115 Free PMC article. - Voltage-gated potassium channels activated during action potentials in layer V neocortical pyramidal neurons.
Kang J, Huguenard JR, Prince DA. Kang J, et al. J Neurophysiol. 2000 Jan;83(1):70-80. doi: 10.1152/jn.2000.83.1.70. J Neurophysiol. 2000. PMID: 10634854 - Spatial distribution of NA+ and K+ channels in spinal dorsal horn neurones: role of the soma, axon and dendrites in spike generation.
Safronov BV. Safronov BV. Prog Neurobiol. 1999 Oct;59(3):217-41. doi: 10.1016/s0301-0082(98)00051-3. Prog Neurobiol. 1999. PMID: 10465379 Review. - Dendritic potassium channels in hippocampal pyramidal neurons.
Johnston D, Hoffman DA, Magee JC, Poolos NP, Watanabe S, Colbert CM, Migliore M. Johnston D, et al. J Physiol. 2000 May 15;525 Pt 1(Pt 1):75-81. doi: 10.1111/j.1469-7793.2000.00075.x. J Physiol. 2000. PMID: 10811726 Free PMC article. Review.
Cited by
- Calcium spikes in basal dendrites of layer 5 pyramidal neurons during action potential bursts.
Kampa BM, Stuart GJ. Kampa BM, et al. J Neurosci. 2006 Jul 12;26(28):7424-32. doi: 10.1523/JNEUROSCI.3062-05.2006. J Neurosci. 2006. PMID: 16837590 Free PMC article. - Distance-dependent homeostatic synaptic scaling mediated by a-type potassium channels.
Ito HT, Schuman EM. Ito HT, et al. Front Cell Neurosci. 2009 Nov 30;3:15. doi: 10.3389/neuro.03.015.2009. eCollection 2009. Front Cell Neurosci. 2009. PMID: 20076774 Free PMC article. - Detailed passive cable models of layer 2/3 pyramidal cells in rat visual cortex at different temperatures.
Trevelyan AJ, Jack J. Trevelyan AJ, et al. J Physiol. 2002 Mar 1;539(Pt 2):623-36. doi: 10.1113/jphysiol.2001.013291. J Physiol. 2002. PMID: 11882693 Free PMC article. - Linearization of excitatory synaptic integration at no extra cost.
Morel D, Singh C, Levy WB. Morel D, et al. J Comput Neurosci. 2018 Apr;44(2):173-188. doi: 10.1007/s10827-017-0673-5. Epub 2018 Jan 25. J Comput Neurosci. 2018. PMID: 29372434 - Potassium channels control the interaction between active dendritic integration compartments in layer 5 cortical pyramidal neurons.
Harnett MT, Xu NL, Magee JC, Williams SR. Harnett MT, et al. Neuron. 2013 Aug 7;79(3):516-29. doi: 10.1016/j.neuron.2013.06.005. Neuron. 2013. PMID: 23931999 Free PMC article.
References
- Bekkers JM, Stuart G. Distribution and properties of potassium channels in the soma and apical dendrites of layer 5 cortical pyramidal neurons. Society for Neuroscience Abstracts. 1998;24:2019.
Publication types
MeSH terms
Substances
LinkOut - more resources
Full Text Sources
Miscellaneous
