Recent common ancestry of human Y chromosomes: evidence from DNA sequence data - PubMed (original) (raw)
Comment
Recent common ancestry of human Y chromosomes: evidence from DNA sequence data
R Thomson et al. Proc Natl Acad Sci U S A. 2000.
Abstract
We consider a data set of DNA sequence variation at three Y chromosome genes (SMCY, DBY, and DFFRY) in a worldwide sample of human Y chromosomes. Between 53 and 70 chromosomes were fully screened for sequence variation at each locus by using the method of denaturing high-performance liquid chromatography. The sum of the lengths of the three genes is 64,120 bp. We have used these data to study the ancestral genealogy of human Y chromosomes. In particular, we focused on estimating the expected time to the most recent common ancestor and the expected ages of certain mutations with interesting geographic distributions. Although the geographic structure of the inferred haplotype tree is reminiscent of that obtained for other loci (the root is in Africa, and most of the oldest non-African lineages are Asian), the expected time to the most recent common ancestor is remarkably short, on the order of 50,000 years. Thus, although previous studies have noted that Y chromosome variation shows extreme geographic structure, we estimate that the spread of Y chromosomes out of Africa is much more recent than previously was thought. We also show that our data indicate substantial population growth in the effective number of human Y chromosomes.
Figures
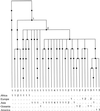
Figure 1
A rendition of the three gene trees, where the mutations (56 single-nucleotide substitutions) are represented by circles, and those mutations that distinguish important geographic clades are numbered 1 and 2 (see Geographic Structure of the Tree).
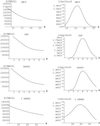
Figure 2
The likelihood curve and expected age of the MRCA in units of_N_ generations, given θ under the model of constant population size. A number of points (nine for the three genes combined) were obtained by using
genetree
, and an error function (cubic spline) was fitted between the points for the likelihood curve (expected age of the MRCA).
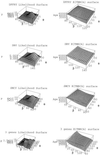
Figure 3
The likelihood surfaces and_E_[_T_MRCA] surfaces in units of _N_0 generations, given θ and β, under the exponential growth model. The three single gene surfaces used an error function to connect nine points on the likelihood curve. For the three genes combined, an error function was used where possible to connect 37 points. When the error function did not fit, linear interpolation was used. A cubic spline was used for all_E_[_T_MRCA] surfaces.
Comment on
- Genome, diversity, and origins: the Y chromosome as a storyteller.
Bertranpetit J. Bertranpetit J. Proc Natl Acad Sci U S A. 2000 Jun 20;97(13):6927-9. doi: 10.1073/pnas.97.13.6927. Proc Natl Acad Sci U S A. 2000. PMID: 10860948 Free PMC article. No abstract available.
Similar articles
- Population genetic implications from sequence variation in four Y chromosome genes.
Shen P, Wang F, Underhill PA, Franco C, Yang WH, Roxas A, Sung R, Lin AA, Hyman RW, Vollrath D, Davis RW, Cavalli-Sforza LL, Oefner PJ. Shen P, et al. Proc Natl Acad Sci U S A. 2000 Jun 20;97(13):7354-9. doi: 10.1073/pnas.97.13.7354. Proc Natl Acad Sci U S A. 2000. PMID: 10861003 Free PMC article. - Out of Africa and back again: nested cladistic analysis of human Y chromosome variation.
Hammer MF, Karafet T, Rasanayagam A, Wood ET, Altheide TK, Jenkins T, Griffiths RC, Templeton AR, Zegura SL. Hammer MF, et al. Mol Biol Evol. 1998 Apr;15(4):427-41. doi: 10.1093/oxfordjournals.molbev.a025939. Mol Biol Evol. 1998. PMID: 9549093 - Population growth of human Y chromosomes: a study of Y chromosome microsatellites.
Pritchard JK, Seielstad MT, Perez-Lezaun A, Feldman MW. Pritchard JK, et al. Mol Biol Evol. 1999 Dec;16(12):1791-8. doi: 10.1093/oxfordjournals.molbev.a026091. Mol Biol Evol. 1999. PMID: 10605120 - Human evolution and the Y chromosome.
Mitchell RJ, Hammer MF. Mitchell RJ, et al. Curr Opin Genet Dev. 1996 Dec;6(6):737-42. doi: 10.1016/s0959-437x(96)80029-3. Curr Opin Genet Dev. 1996. PMID: 8994845 Review. - Fathers and sons: the Y chromosome and human evolution.
Jobling MA, Tyler-Smith C. Jobling MA, et al. Trends Genet. 1995 Nov;11(11):449-56. doi: 10.1016/s0168-9525(00)89144-1. Trends Genet. 1995. PMID: 8578602 Review.
Cited by
- Genome-wide identification and annotation of SNPs for economically important traits in Frieswal™, newly evolved crossbred cattle of India.
Raja TV, Alex R, Singh U, Kumar S, Das AK, Sengar G, Singh AK, Ghosh A, Saha S, Mitra A. Raja TV, et al. 3 Biotech. 2023 Sep;13(9):310. doi: 10.1007/s13205-023-03701-0. Epub 2023 Aug 22. 3 Biotech. 2023. PMID: 37621321 Free PMC article. - Convergent evolution of AP2/ERF III and IX subfamilies through recurrent polyploidization and tandem duplication during eudicot adaptation to paleoenvironmental changes.
Guo L, Wang S, Nie Y, Shen Y, Ye X, Wu W. Guo L, et al. Plant Commun. 2022 Nov 14;3(6):100420. doi: 10.1016/j.xplc.2022.100420. Epub 2022 Aug 10. Plant Commun. 2022. PMID: 35949168 Free PMC article. - Supergene potential of a selfish centromere.
Finseth F, Brown K, Demaree A, Fishman L. Finseth F, et al. Philos Trans R Soc Lond B Biol Sci. 2022 Aug;377(1856):20210208. doi: 10.1098/rstb.2021.0208. Epub 2022 Jun 13. Philos Trans R Soc Lond B Biol Sci. 2022. PMID: 35694746 Free PMC article. - Evolutionary Genetic Signatures of Selection on Bone-Related Variation within Human and Chimpanzee Populations.
Stover DA, Housman G, Stone AC, Rosenberg MS, Verrelli BC. Stover DA, et al. Genes (Basel). 2022 Jan 21;13(2):183. doi: 10.3390/genes13020183. Genes (Basel). 2022. PMID: 35205228 Free PMC article. - Evidence for opposing selective forces operating on human-specific duplicated TCAF genes in Neanderthals and humans.
Hsieh P, Dang V, Vollger MR, Mao Y, Huang TH, Dishuck PC, Baker C, Cantsilieris S, Lewis AP, Munson KM, Sorensen M, Welch AE, Underwood JG, Eichler EE. Hsieh P, et al. Nat Commun. 2021 Aug 25;12(1):5118. doi: 10.1038/s41467-021-25435-4. Nat Commun. 2021. PMID: 34433829 Free PMC article.
References
- Vigilant L, Stoneking M, Harpending H, Hawkes K, Wilson A C. Science. 1991;253:1503–1507. - PubMed
- Bowcock A M, Ruiz-Linares A, Tomfohrde J, Minch E, Kidd J R, Cavalli-Sforza L L. Nature (London) 1994;368:455–457. - PubMed
Publication types
MeSH terms
Grants and funding
- GM28016/GM/NIGMS NIH HHS/United States
- R01 GM028016/GM/NIGMS NIH HHS/United States
- P01 GM028428/GM/NIGMS NIH HHS/United States
- GM28428/GM/NIGMS NIH HHS/United States
- Wellcome Trust/United Kingdom
LinkOut - more resources
Full Text Sources
Other Literature Sources


