T-type alpha 1H Ca2+ channels are involved in Ca2+ signaling during terminal differentiation (fusion) of human myoblasts - PubMed (original) (raw)
T-type alpha 1H Ca2+ channels are involved in Ca2+ signaling during terminal differentiation (fusion) of human myoblasts
P Bijlenga et al. Proc Natl Acad Sci U S A. 2000.
Abstract
Mechanisms underlying Ca(2+) signaling during human myoblast terminal differentiation were studied using cell cultures. We found that T-type Ca(2+) channels (T-channels) are expressed in myoblasts just before fusion. Their inhibition by amiloride or Ni(2+) suppresses fusion and prevents an intracellular Ca(2+) concentration increase normally observed at the onset of fusion. The use of antisense oligonucleotides indicates that the functional T-channels are formed by alpha1H subunits. At hyperpolarized potentials, these channels allow a window current sufficient to increase [Ca(2+)](i). As hyperpolarization is a prerequisite to myoblast fusion, we conclude that the Ca(2+) signal required for fusion is produced when the resting potential enters the T-channel window. A similar mechanism could operate in other cell types of which differentiation implicates membrane hyperpolarization.
Figures
Figure 1
A subpopulation with increased resting [Ca2+]i appears in fusing myoblasts. Myoblasts have been distributed in 16 bins of 10 nM according to their resting [Ca2+]i. Distributions were fitted with either a simple (Inset, undifferentiated myoblasts: UD-MB) or a double (fusion-competent myoblasts: FC-MB) Gaussian equation. To emphasize the difference, the double Gaussian fit from the main graph is shown in the inset as a broken line.
Figure 2
Currents through T-type Ca2+ channels in fusion-competent myoblasts. Ba2+ (10 mM) was used as a charge carrier. (A) The cell was held steadily at −90 mV and stepped to values between −70 mV and +30 mV for 80 ms. Peak T-currents were plotted in the absence (squares) and in the presence of 300 μM amiloride (circles). Leak current was estimated by adding 1 mM Cd2+ and was subtracted. (Inset) Voltage step to −20 mV. (B) Another cell. Voltage step to −10 mV. Ni2+ (50 μM) also blocks T-channels.
Figure 3
Presence of T-channel α1 subunits in fusing myoblasts and myotubes. (A) PCR products of expected sizes for the three α1 subunits were obtained from human fusion-competent myoblasts (FC) and myotubes (MT). Sequencing revealed 100% identity with sequences of human Ca2+ channel subunits. (B) Whole-cell T-type Ca2+ conductances recorded in small myotubes 48 h after cytoplasmic injection of antisense (AS) or scrambled (SCR) oligonucleotides. Between 10 and 13 cells were recorded in each condition.
Figure 4
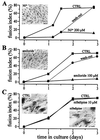
Ni2+ and amiloride, but not nifedipine, inhibit myoblast fusion. (A and B) Myoblast fusion is inhibited by Ni2+ (A) and amiloride (B), and the effect is reversible. Fusion was induced with differentiation medium and was assessed three times within 3 days in culture. The fusion index is defined as the number of nuclei in myotubes divided by the total number of nuclei counted (16). Fusion in control conditions is represented by squares. In sister cultures, the two compounds were added to the differentiation medium either during the entire experiment (triangles) or for a period of 24–36 h (circles). Error bars are omitted because they are smaller than symbols. (C) Myoblast fusion is not affected by nifedipine. Squares represent the fusion rate in control conditions and triangles in the presence of 10 μM nifedipine. Photographs represent hematoxylin-stained cultures after 3 days in differentiation medium without (CTRL) and with Ni2+, amiloride, or nifedipine. (Bars = 40 μm.)
Figure 5
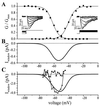
Whole-cell properties of the T-type Ca2+ current. Ca2+ (1.8 mM) was used as a charge carrier. (A) Fusion-competent myoblast. Circles represent the normalized activation conductance curve (holding potential between steps was −100 mV) and squares the normalized inactivation conductance curve (steady holding potential between steps lasted 10 s). Conductances were normalized to the maximum conductance and were fitted with a Boltzmann equation. (Left Inset) Current traces from steady-state inactivation voltage protocol (test potential was to −30 mV). (Right Inset) Current traces during depolarizing steps. Leak current was obtained by adding 1 mM Cd2+, and was subtracted. (B) Predicted T-window current, same cell as in A. The predicted T-window current was obtained by multiplying the predicted T-window conductance by the driving force on calcium ions. Predicted T-window conductance was calculated by multiplying the activation conductance curve (not normalized) by the normalized inactivation conductance curve. (C) T-window current recorded in a small myotube. The voltage protocol to obtain the continuous line representing the computed window current was the same as in B. Open triangles represent the inward Ca2+ current directly measured when the cell was held steadily for 3 s at potentials between −45 mV and −75 mV (steps of −2 mV). Ca2+ currents were measured at the end of the 3-s holding potentials to ensure that T-channels were at steady-state. Leak current was estimated by linear extrapolation of the current record at potential between −69 and −75 mV, and was subtracted. Closed triangles represent the currents evaluated during the same voltage protocol but after addition of 1 mM Cd2. The difference between computed and directly measured window current at potentials more depolarized than −50 mV could be explained by a residual activation of Ca2+-dependent outward currents.
Figure 6
The T-window Ca2+ current is large enough to induce a change in [Ca2+]i. Myotubes had a mean capacitance of 160 ± 28 pF. Ca2+ (1.8 mM) was used as the charge carrier. The main graph represents the mean 405 nm/485 nm indo-1 ratio variations of five small myotubes during three different voltage steps. The cells were stepped at −75 mV (squares), −55 mV (circles), and −35 mV (triangles) for 75 s because it is the required time for [Ca2+]i to reach a steady-state. Maximum ratio increases during the step to −35 mV were normalized to 1. Continuous and dashed lines are decaying exponential fitted to the data points. (Inset) Indo-1 fluorescence ratios were evaluated during the last 10 s of the three voltage steps. Closed symbols represent the [Ca2+]i in control conditions, and open symbols the [Ca2+]i when mibefradil (10 μM) was added. Same five cells as main graph. Note that mibefradil was used rather than amiloride or Ni2+ because these agents affected the fluorescent signal of the extracellular solution.
Figure 7
Model of the events leading to an increase in [Ca2+]i in fusing myoblasts.
Similar articles
- Involvement of K(Ca) channels and stretch-activated channels in calcium influx, triggering membrane fusion of chick embryonic myoblasts.
Shin KS, Park JY, Ha DB, Chung CH, Kang MS. Shin KS, et al. Dev Biol. 1996 Apr 10;175(1):14-23. doi: 10.1006/dbio.1996.0091. Dev Biol. 1996. PMID: 8608860 - Properties and role of voltage-dependent calcium channels during mouse skeletal muscle differentiation.
Bidaud I, Monteil A, Nargeot J, Lory P. Bidaud I, et al. J Muscle Res Cell Motil. 2006;27(1):75-81. doi: 10.1007/s10974-006-9058-5. Epub 2006 Mar 15. J Muscle Res Cell Motil. 2006. PMID: 16538437 - Identification of T-type alpha1H Ca2+ channels (Ca(v)3.2) in major pelvic ganglion neurons.
Lee JH, Kim EG, Park BG, Kim KH, Cha SK, Kong ID, Lee JW, Jeong SW. Lee JH, et al. J Neurophysiol. 2002 Jun;87(6):2844-50. doi: 10.1152/jn.2002.87.6.2844. J Neurophysiol. 2002. PMID: 12037187 - Human myoblast differentiation: Ca(2+) channels are activated by K(+) channels.
Bernheim L, Bader CR. Bernheim L, et al. News Physiol Sci. 2002 Feb;17:22-6. News Physiol Sci. 2002. PMID: 11821532 Review. - [Cognitive Function and Calcium. Cognitive improvement through T type calcium channel stimulation].
Fukunaga K. Fukunaga K. Clin Calcium. 2015 Feb;25(2):247-54. Clin Calcium. 2015. PMID: 25634050 Review. Japanese.
Cited by
- Specification of skeletal muscle differentiation by repressor element-1 silencing transcription factor (REST)-regulated Kv7.4 potassium channels.
Iannotti FA, Barrese V, Formisano L, Miceli F, Taglialatela M. Iannotti FA, et al. Mol Biol Cell. 2013 Feb;24(3):274-84. doi: 10.1091/mbc.E11-12-1044. Epub 2012 Dec 14. Mol Biol Cell. 2013. PMID: 23242999 Free PMC article. - Cdo Regulates Surface Expression of Kir2.1 K+ Channel in Myoblast Differentiation.
Leem YE, Jeong HJ, Kim HJ, Koh J, Kang K, Bae GU, Cho H, Kang JS. Leem YE, et al. PLoS One. 2016 Jul 5;11(7):e0158707. doi: 10.1371/journal.pone.0158707. eCollection 2016. PLoS One. 2016. PMID: 27380411 Free PMC article. - Ryanodine receptor RyR1-mediated elevation of Ca2+ concentration is required for the late stage of myogenic differentiation and fusion.
Qiu K, Wang Y, Xu D, He L, Zhang X, Yan E, Wang L, Yin J. Qiu K, et al. J Anim Sci Biotechnol. 2022 Feb 11;13(1):9. doi: 10.1186/s40104-021-00668-x. J Anim Sci Biotechnol. 2022. PMID: 35144690 Free PMC article. - Age-dependent impact of CaV 3.2 T-type calcium channel deletion on myogenic tone and flow-mediated vasodilatation in small arteries.
Mikkelsen MF, Björling K, Jensen LJ. Mikkelsen MF, et al. J Physiol. 2016 Oct 15;594(20):5881-5898. doi: 10.1113/JP271470. Epub 2016 Feb 18. J Physiol. 2016. PMID: 26752249 Free PMC article. - Acceleration of myofiber formation in culture by a digitized synaptic signal.
Zemianek JM, Lee S, Shea TB. Zemianek JM, et al. Tissue Eng Part A. 2013 Dec;19(23-24):2693-702. doi: 10.1089/ten.TEA.2012.0619. Epub 2013 Sep 17. Tissue Eng Part A. 2013. PMID: 23859139 Free PMC article.
References
- Shainberg A, Yagil G, Yaffe D. Exp Cell Res. 1969;58:163–167. - PubMed
- Przybylski R J, MacBride R G, Kirby A C. In Vitro Cell Dev Biol. 1989;25:830–838. - PubMed
- Przybylski R J, Szigeti V, Davidheiser S, Kirby A C. Cell Calcium. 1994;15:132–142. - PubMed
- David J D, See W M, Higginbotham C A. Dev Biol. 1981;82:297–307. - PubMed
Publication types
MeSH terms
Substances
LinkOut - more resources
Full Text Sources
Other Literature Sources
Molecular Biology Databases
Research Materials
Miscellaneous


