Molecular and functional heterogeneity of hyperpolarization-activated pacemaker channels in the mouse CNS - PubMed (original) (raw)
Comparative Study
Molecular and functional heterogeneity of hyperpolarization-activated pacemaker channels in the mouse CNS
B Santoro et al. J Neurosci. 2000.
Abstract
The hyperpolarization-activated cation current (termed I(h), I(q), or I(f)) was recently shown to be encoded by a new family of genes, named HCN for hyperpolarization-activated cyclic nucleotide-sensitive cation nonselective. When expressed in heterologous cells, each HCN isoform generates channels with distinct activation kinetics, mirroring the range of biophysical properties of native I(h) currents recorded in different classes of neurons. To determine whether the functional diversity of I(h) currents is attributable to different patterns of HCN gene expression, we determined the mRNA distribution across different regions of the mouse CNS of the three mouse HCN genes that are prominently expressed there (mHCN1, 2 and 4). We observe distinct patterns of distribution for each of the three genes. Whereas mHCN2 shows a widespread expression throughout the CNS, the expression of mHCN1 and mHCN4 is more limited, and generally complementary. mHCN1 is primarily expressed within neurons of the neocortex, hippocampus, and cerebellar cortex, but also in selected nuclei of the brainstem. mHCN4 is most highly expressed within neurons of the medial habenula, thalamus, and olfactory bulb, but also in distinct neuronal populations of the basal ganglia. Based on a comparison of mRNA expression with an electrophysiological characterization of native I(h) currents in hippocampal and thalamic neurons, our data support the idea that the functional heterogeneity of I(h) channels is attributable, in part, to differential isoform expression. Moreover, in some neurons, specific functional roles can be proposed for I(h) channels with defined subunit composition.
Figures
Fig. 1.
mHCN2 and mHCN4 are expressed in olfactory bulb.A, Coronal section (bregma, +4.28 mm) showing labeling by mHCN2 probe of mitral cells, tufted cells, and short-axon cells (arrowhead). B, mHCN4 transcripts are present in mitral cells and tufted cells (_arrowhead_shows externally placed tufted cells), but not in short-axon cells.gcl, Granule cell layer; epl, external plexiform layer; gl, glomerular layer. Scale bar, 200 μm.
Fig. 2.
Expression of mHCN2 and mHCN4 mRNA in the mouse basal forebrain. A, Coronal section (bregma, +0.74) showing mHCN2 labeling in the medial septum (ms), vertical and horizontal limb of the diagonal band (db), and ventral pallidum (vp). B, Coronal section (bregma, −0.82) showing staining by the mHCN2 probe of cells in the caudate putamen (cp), lateral globus pallidus (lgp), thalamus nucleus reticularis (nrt), ventral anterior thalamic nucleus (va), and anterodorsal thalamic nucleus (ad).C, Coronal section (bregma, −0.82) showing staining by the mHCN4 probe of cells in the caudate putamen, lateral globus pallidus, and anterodorsal thalamic nucleus. mHCN4 is not present in thalamus nucleus reticularis. Scale bars, 500 μm.
Fig. 3.
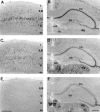
Differential distribution of mHCN1, mHCN2, and mHCN4 in the mouse cerebral and hippocampal cortex. _A,_Coronal section (bregma, +0.74) showing mHCN1 labeling in the motor cortex. B, Coronal section (bregma, −2.06) showing mHCN1 labeling in the hippocampus. C, mHCN2 labeling in the motor cortex. D, mHCN2 labeling in the hippocampus, lateral habenula, and dorsal lateral geniculate nucleus.E, mHCN4 labeling is absent in the motor cortex.F, mHCN4 labeling in the hippocampus, medial and lateral habenula, and dorsal lateral geniculate nucleus. ec, External capusle; mh, medial habenula;lh, lateral habenula; dlg, dorsal lateral geniculate nucleus; DG, dentate gyrus;CA 1, CA 3,cornus ammonis fields CA1 and CA3. Scale bars, 500 μm.
Fig. 4.
Expression of mHCN2 and mHCN4 in the mouse thalamus. A, Coronal section (bregma, −1.58) showing labeling of laterodorsal (ld), ventroposterior (vp), and reticular (nrt) thalamic nuclei by mHCN2 probe. Also visible is the labeling of cells in the medial globus pallidus (mgp). B, Labeling by mHCN4 probe of laterodorsal and ventroposterior thalamic nuclei. Weak labeling is also visible in the medial globus pallidus. Scale bar, 500 μm.
Fig. 5.
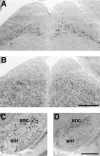
Expression of mHCN1, mHCN2, and mHCN4 transcripts in midbrain. A, Coronal section (bregma, −4.04) showing mHCN1 labeling in the superior colliculus. B, mHCN2 labeling in the superior colliculus. C, Coronal section (bregma, −3.28) showing staining for mHCN2 in substantia nigra, pars reticulata (snr). D, Staining for mHCN4 in substantia nigra, mostly pars compacta (snc). Scale bars, 500 μm.
Fig. 6.
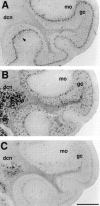
Differential expression of mHCN1, mHCN2, and mHCN4 transcripts in cerebellum. A, Coronal section (bregma, −6.24) showing labeling of Purkinje cells by mHCN1 probe. Weak labeling of basket cells (arrowheads) is also visible in the molecular layer (mo). B, Labeling of Purkinje cell layer, granule cell layer (gc), and deep cerebellar nuclei (dcn) by mHCN2 probe.C, mHCN4 labeling in deep cerebellar nuclei. Scale bar, 500 μm.
Fig. 7.
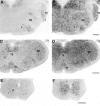
mHCN1 is expressed in selected nuclei in the brainstem and spinal cord. A, Coronal section (bregma, −6.24) showing labeling of ventral cochlear nucleus (vc), spinal trigeminal nucleus (sp), and facial nucleus (7) by mHCN1 probe. Weak labeling of vestibular nuclei is also visible. B, Serial section showing labeling by mHCN2 probe. C, Coronal section (bregma, −7.08) showing labeling of hypoglossal nucleus (12) by mHCN1 probe. Weak labeling of spinal trigeminal and lateral reticular nuclei, as well as of inferior olive (io) is also visible. D, Serial section showing labeling by mHCN2 probe. E, Coronal section through thoracic spinal cord showing labeling by mHCN1 probe; notice strong labeling of the motorneurons in the ventral horn (arrowhead). F, Serial section showing labeling by mHCN2 probe. Scale bars, 500 μm.
Fig. 8.
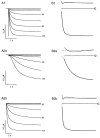
Distinct functional properties of_I_h currents generated by mHCN1 and mHCN2.A, Currents generated in response to hyperpolarizing voltage steps in Xenopus oocytes expressing mHCN1 (A1) or mHCN2 (A2), respectively.A1, mHCN1 currents shown during 3-sec-long hyperpolarizing voltage steps. A2a,b, mHCN2 currents shown during initial 3 sec (A2a) and entire 30 sec time course (A2b) in response to hyperpolarizing voltage steps. For both A1 and A2, membrane held at −30 mV and stepped from −35 to −105 mV in 10 mV increments (selected voltages indicated to right of current traces). B, Two exponential components are required to adequately fit activation time course of mHCN currents. Time and current scales as in corresponding panels in A. For_B1_ and B2, bottom traces_show current during hyperpolarizing step to −105 mV with superimposed fit using two exponential components. The middle and_top traces show the residuals of difference between the recorded current and the fitted single (top trace) or double (middle trace) exponential functions. Zero current is indicated by the arrowhead (labeled 0). The residuals from the single exponential fits are displaced from zero for clarity; zero current for these traces is indicated by the_dashed line_. To facilitate comparison between mHCN1 and mHCN2, the first 3 sec of the mHCN2 activation time course and fits to this are shown on an expanded time scale in B2a.
Fig. 9.
Comparison of kinetic and steady-state activation properties between mHCN1 and mHCN2. A, Fast (open symbols) and slow (filled symbols) exponential time constants as function of voltage during hyperpolarizing step. For all panels: circles, mHCN1;squares, mHCN2. B, Relative amplitude of fast exponential component as function of hyperpolarizing voltage step. Af and As are the amplitudes of the fast and slow exponential components, respectively.C, Steady-state tail current activation curves obtained using 30 sec hyperpolarizing steps for mHCN2 channels and 3 sec steps for mHCN1 channels. Curves fit with Boltzmann relation (see Materials and Methods for details). D, Relation between values of _V_1/2 determined from activation curves using hyperpolarizing steps of different durations for mHCN1 and mHCN2 channels.
Fig. 10.
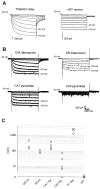
Differential functional properties of_I_h in thalamic and hippocampal neurons as assessed by whole-cell patch-clamp recordings. A,Current recording from a thalamocortical relay cell from the ventral posterior nucleus (left) and from a nucleus reticularis neuron (right). Holding potential was −58 mV, and the voltage was stepped to negative potentials for 2.8 sec in 5 mV increments to −103 mV. Scale bars as indicated or as in_B for time. B, Recordings from hippocampal neurons. Top left, Stratum oriens/alveus (O/A) interneuron; top right, stratum radiatum (SR) interneuron; bottom left, CA1 pyramidal neuron; bottom right, CA3 pyramidal neuron. In each case, the holding potential was −63, and the voltage was stepped to negative potentials for 3 sec in 10 mV increments down to −123 mV. Calibration: 200 pA, 0.5 sec. C, Comparison of peak current in the six cell types shown in A and_B. Each point is an individual experiment. The_I_h current at the end of 2.8- to 3-sec-long voltage steps to −103 mV was measured as the difference between the net current record and the leakage current, measured from the initial current level after the capacitative transient at the beginning of each voltage step.
Fig. 11.
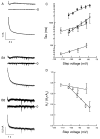
Comparison of biexponential activation kinetics of _I_h current in native neurons. A, B, Double exponential fit of current traces for thalamic relay neuron (A), hippocampal OA interneuron (B1), and hippocampal CA1 pyramidal neuron (B2) during hyperpolarizing voltage step to −103 mV. Step length was 11.2 sec for thalamocortical relay cell and 3 sec for hippocampal cells. From bottom, traces show superimposed currents and biexponential fits, residuals from biexponential fits, and residuals from single exponential fits. C, “Fast” (open symbols) and “slow” (filled symbols) time constants of activation as function of voltage for thalamic relay neurons (squares) and hippocampal CA1 pyramidal neurons (circles); n = 4.D, Relative amplitude of the fast exponential component as function of voltage. Circles, Hippocampal CA1 neurons. Squares, Thalamic relay neurons.
Fig. 12.
Summary comparing HCN isoform mRNA expression with time constants of activation for recombinant HCN isoforms and native _I_h currents. Top, Fast (open circles) and slow (filled circles) exponential time constants of activation for different HCN isoforms from biexponential fits during voltage step to −105 mV.Diamonds show time constants from single exponential fits, reflecting predominant fast component. Bottom, Fast and slow exponential time constants for _I_hin thalamocortical relay neurons, hippocampal O/A interneurons, and hippocampal CA1 pyramidal neurons. Data show mean ± SE for fast and slow components. Panel on right summarizes relative expression levels for mHCN1, 2, and 4 mRNA. Data for HCN4:circles, at −110 mV and 35°C (Ishii et al., 1999);diamonds, extrapolated to −105 mV (Seifert et al., 1999) and scaled to 34°C.
Similar articles
- Properties of hyperpolarization-activated pacemaker current defined by coassembly of HCN1 and HCN2 subunits and basal modulation by cyclic nucleotide.
Chen S, Wang J, Siegelbaum SA. Chen S, et al. J Gen Physiol. 2001 May;117(5):491-504. doi: 10.1085/jgp.117.5.491. J Gen Physiol. 2001. PMID: 11331358 Free PMC article. - Differential and age-dependent expression of hyperpolarization-activated, cyclic nucleotide-gated cation channel isoforms 1-4 suggests evolving roles in the developing rat hippocampus.
Bender RA, Brewster A, Santoro B, Ludwig A, Hofmann F, Biel M, Baram TZ. Bender RA, et al. Neuroscience. 2001;106(4):689-98. doi: 10.1016/s0306-4522(01)00314-1. Neuroscience. 2001. PMID: 11682156 Free PMC article. - Hyperpolarization-activated cation currents: from molecules to physiological function.
Robinson RB, Siegelbaum SA. Robinson RB, et al. Annu Rev Physiol. 2003;65:453-80. doi: 10.1146/annurev.physiol.65.092101.142734. Epub 2002 Nov 19. Annu Rev Physiol. 2003. PMID: 12471170 Review. - Molecular diversity of pacemaker ion channels.
Kaupp UB, Seifert R. Kaupp UB, et al. Annu Rev Physiol. 2001;63:235-57. doi: 10.1146/annurev.physiol.63.1.235. Annu Rev Physiol. 2001. PMID: 11181956 Review.
Cited by
- The thalamo-cortical complex network correlates of chronic pain.
Zippo AG, Valente M, Caramenti GC, Biella GE. Zippo AG, et al. Sci Rep. 2016 Oct 13;6:34763. doi: 10.1038/srep34763. Sci Rep. 2016. PMID: 27734895 Free PMC article. - An essential role for modulation of hyperpolarization-activated current in the development of binaural temporal precision.
Khurana S, Liu Z, Lewis AS, Rosa K, Chetkovich D, Golding NL. Khurana S, et al. J Neurosci. 2012 Feb 22;32(8):2814-23. doi: 10.1523/JNEUROSCI.3882-11.2012. J Neurosci. 2012. PMID: 22357864 Free PMC article. - Potential synergistic action of 19 schizophrenia risk genes in the thalamus.
Richard EA, Khlestova E, Nanu R, Lisman JE. Richard EA, et al. Schizophr Res. 2017 Feb;180:64-69. doi: 10.1016/j.schres.2016.09.008. Epub 2016 Sep 16. Schizophr Res. 2017. PMID: 27645107 Free PMC article. Review. - Novel role of KT5720 on regulating hyperpolarization-activated cyclic nucleotide-gated channel activity and dorsal root ganglion neuron excitability.
Cheng Q, Zhou Y. Cheng Q, et al. DNA Cell Biol. 2013 Jun;32(6):320-8. doi: 10.1089/dna.2013.2021. DNA Cell Biol. 2013. PMID: 23713946 Free PMC article. - Using a Multiplex Nucleic Acid in situ Hybridization Technique to Determine HCN4 mRNA Expression in the Adult Rodent Brain.
Oyrer J, Bleakley LE, Richards KL, Maljevic S, Phillips AM, Petrou S, Nowell CJ, Reid CA. Oyrer J, et al. Front Mol Neurosci. 2019 Aug 28;12:211. doi: 10.3389/fnmol.2019.00211. eCollection 2019. Front Mol Neurosci. 2019. PMID: 31555092 Free PMC article.
References
- Bland BH, Oddie SD. Anatomical, electrophysiological and pharmacological studies of ascending brainstem hippocampal synchronizing pathways. Neurosci Biobehav Rev. 1998;22:259–273. - PubMed
- Beaumont V, Zucker RS. Enhancement of synaptic transmission by cyclic AMP modulation of presynaptic Ih channels. Nat Neurosci. 2000;3:133–141. - PubMed
- Clapham DE. Not so funny anymore: pacing channels are cloned. Neuron. 1998;21:5–7. - PubMed
- DiFrancesco D. Pacemaker mechanisms in cardiac tissue. Annu Rev Physiol. 1993;55:455–472. - PubMed
Publication types
MeSH terms
Substances
LinkOut - more resources
Full Text Sources
Other Literature Sources


