BNIP3 and genetic control of necrosis-like cell death through the mitochondrial permeability transition pore - PubMed (original) (raw)
BNIP3 and genetic control of necrosis-like cell death through the mitochondrial permeability transition pore
C Vande Velde et al. Mol Cell Biol. 2000 Aug.
Abstract
Many apoptotic signaling pathways are directed to mitochondria, where they initiate the release of apoptogenic proteins and open the proposed mitochondrial permeability transition (PT) pore that ultimately results in the activation of the caspase proteases responsible for cell disassembly. BNIP3 (formerly NIP3) is a member of the Bcl-2 family that is expressed in mitochondria and induces apoptosis without a functional BH3 domain. We report that endogenous BNIP3 is loosely associated with mitochondrial membrane in normal tissue but fully integrates into the mitochondrial outer membrane with the N terminus in the cytoplasm and the C terminus in the membrane during induction of cell death. Surprisingly, BNIP3-mediated cell death is independent of Apaf-1, caspase activation, cytochrome c release, and nuclear translocation of apoptosis-inducing factor. However, cells transfected with BNIP3 exhibit early plasma membrane permeability, mitochondrial damage, extensive cytoplasmic vacuolation, and mitochondrial autophagy, yielding a morphotype that is typical of necrosis. These changes were accompanied by rapid and profound mitochondrial dysfunction characterized by opening of the mitochondrial PT pore, proton electrochemical gradient (Deltapsim) suppression, and increased reactive oxygen species production. The PT pore inhibitors cyclosporin A and bongkrekic acid blocked mitochondrial dysregulation and cell death. We propose that BNIP3 is a gene that mediates a necrosis-like cell death through PT pore opening and mitochondrial dysfunction.
Figures
FIG. 1
BNIP3 expression and integration into the mitochondrial membrane. (A) Left panel: mitochondrion-enriched heavy membrane (HM) and S-100 cytosol (S-100) subcellular fractions of mouse tissues were isolated and alkali extracted as described in Materials and Methods, then Western blotted with polyclonal anti-BNIP3 antibody. BNIP3 lanes are lysates of 293T cells transfected with BNIP3. Right panel: HeLa cells were fractionated as described above, and fractions were Western blotted with monoclonal anti-BNIP3 antibody Ana40. Nonspecific staining was evaluated by adding GST-hBNIP3 to a parallel incubation mixture. (B) Subcellular fractions of hBNIP3-T7-transfected 293T (top) and MCF-7 (middle) cells were alkali extracted and blotted with mouse monoclonal anti-BNIP3 Ana40 antibody. Mouse skeletal muscle tissue prepared in the same manner was blotted for BCL-XL (bottom). (C) Mitochondrial heavy membrane fractions from hBNIP3-T7-transfected 293T cells were trypsin digested and/or alkali extracted, as described in Materials and Methods, and blotted with either Ana40 mouse monoclonal anti-hBNIP3 or anti-T7 antibodies. Arrows indicate specific antibody-reactive bands at 40, 18, and 8 kDa. P, heavy membrane pellet; S, S-100 supernatant.
FIG. 2
Broad-spectrum caspase inhibitors Ac-zVAD-fmk and baculovirus p35 fail to inhibit BNIP3-induced cell death. (A) 293T cells were transiently cotransfected with the reporter plasmid pcDNA3-βgal and either BNIP3-T7 (●) or inactive mutant BNIP3ΔTM-T7 (⧫). Cells transfected with tBID-FLAG (■) or caspase 9-His6 plus Apaf-1 (▴) served as positive controls. All groups were treated with increasing concentrations of Ac-zVAD-fmk. (B) In a parallel experiment, 293T cells were transfected as above with increasing concentrations of pcDNA1-p35. At 27 h posttransfection, cells were fixed, stained, and evaluated for dead cells as described in Materials and Methods. The data represent one of three independent experiments with similar results.
FIG. 3
BNIP3 does not activate caspases. (A) BNIP3 expression does not activate a DEVDase. Lysates from 293T cells transfected with BNIP3-T7, BNIP3ΔTM-T7, or tBID-FLAG were harvested at 1, 12, 18, 24, and 36 h and then incubated with the substrate DEVD-pNA in the presence (solid bars) or absence (shaded bars) of 500 nM Ac-DEVD-fmk. Fold activation was determined as the ratio of transfected cells to untransfected controls. Results are expressed as the mean ± standard error (SE) from at least three independent experiments. (B) BNIP3 expression fails to activate PARP cleavage. Lysates from BNIP3-T7-, BNIP3ΔTM-T7-, or BAX-transfected 293T cells were harvested at 12, 24, 36, and 48 h posttransfection and immunoblotted with mouse monoclonal anti-PARP antibody. Arrows indicate the unprocessed p116 and processed p85 bands. (C) BNIP3 expression fails to activate procaspase 3 processing. Lysates from BNIP3-T7-, BNIP3ΔTM-T7-, or BAX-transfected 293T cells were harvested 24 h posttransfection and immunoblotted with mouse monoclonal anti-procaspase 3 antibody. The arrow indicates the unprocessed p32 band. Lane C, untreated control.
FIG. 4
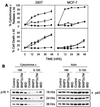
BNIP3 does not induce mitochondrial cytochrome c release. (A) 293T cells transiently transfected with BNIP3-T7, BNIP3ΔTM-T7, or tBID-FLAG were stained with monoclonal anti-cytochrome c antibody and Cy3-labeled anti-mouse IgG antibody then evaluated by fluorescent microscopy. Time course of cytochrome c release and apoptosis following BNIP3-T7 (▾), BNIP3ΔTM-T7 (■), or tBID-FLAG (●) transfection of 293T (left panels) and MCF-7 (right panels) cells is shown. Cytochrome c release was scored as the loss of cytoplasmic granular staining. Apoptotic cells were scored based on chromatin condensation following Hoechst staining. The data from three independent experiments are shown as the mean ± SE for each time point. (B) Western blot analysis of the time course of release of cytochrome c from mitochondria into S-100 cytosol. Aliquots of 5 μg of heavy membrane (HM) and S-100 fractions from 293T cells transiently transfected with BNIP3, BNIP3ΔTM, or tBID were harvested at 18, 24, and 36 h posttransfection and Western blotted with mouse anti-cytochrome c antibody (p16). The same membrane was blotted with mouse antiactin antibody (p43) to demonstrate equal loading. Control, untransfected cells.
FIG. 5
BNIP3-induced cell death in the absence of Apaf-1, caspase 9, or caspase 3. (A) Wild-type, Apaf-1−/−, caspase 9−/−, and caspase 3−/− MEFs were transiently cotransfected with pcDNA3-βgal vector alone, BNIP3-T7, or BNIP3ΔTM-T7 and then scored for dead cells as described in Materials and Methods. Results are expressed as the mean ± SE from three independent experiments. (B) The same cell aliquots of wild-type (WT), Apaf-1−/−, caspase 9−/− (Casp 9−/−), and caspase 3−/− (Casp 3−/−) MEFs used for the experiments in panel A were transfected with pcDNA3-βgal and treated with medium or with 3 μg of adriamycin per ml for 24 h, and dead cells were enumerated in three experiments. N, _N_-Dimethyl formamide (DMF) was used to dilute the adriamycin.
FIG. 6
BNIP3 induces rapid plasma membrane permeability but not PS externalization. (A) Untransfected and BNIP3-T7-transfected 293T cells were harvested at 2, 4, 8, and 12 h posttransfection and stained with PI. PI+ cells are expressed as the mean ± SE of three or four experiments for each time point. (B) Untransfected 293T cells (C) and 293T cells transfected with BNIP3-T7 (BNIP3), BNIP3ΔTM-T7 (ΔTM), tBID-FLAG (tBID), BAX, or caspase 9/Apaf-1 (C9/A) were harvested at 12 h posttransfection and stained for annexin V and PI. Cells that were gated as PS+ PI− are expressed as the mean ± SE of three independent experiments.
FIG. 7
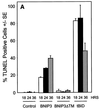
BNIP3-induced cell death is characterized by late DNA fragmentation. (A) Quantification of TUNEL-positive 293T cells transiently transfected with BNIP3-T7, BNIP3ΔTM-T7, or tBID-FLAG and stained at 18, 24, and 36 h. Values for BNIP3- and tBID-transfected cells were significantly higher than those for controls at all time points (P < 0.01). (B) Illustration of transfected cells as in panel A harvested 24 h posttransfection and stained with the TUNEL reagent (right) or Hoechst dye (left). (C) Cells were transfected as in panel A in the absence (open bars) or presence of 50 μM Ac-FA-fmk (solid bars) or 50 μM Ac-zVAD-fmk (hatched bars). Cells were TUNEL stained 24 h posttransfection, and the percent positive was scored by fluorescent microscopy.
FIG. 8
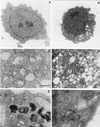
BNIP3 induces ultrastructural changes of necrosis. Normal 293T cells (A) and BNIP3-expressing 293T cells (B to F) were examined 24 h posttransfection by transmission electron microscopy. Nuclei of BNIP3-expressing cells exhibited dispersed foci of chromatin condensation and heterochromatin (B) compared to control cells (A). High-power magnifications of BNIP3 transfectants showed rounded mitochondria with disrupted internal structures (arrows) (C), extensive cytoplasmic vacuolation (D), autophagosomes (arrows) (E), and autophagic vacuoles containing membranous whorls (F). (A and B), bar, 1 μm; (C to F) bar, 0.5 μm.
FIG. 9
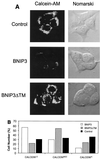
BNIP3-induced cell death is characterized by mitochondrial dysfunction. (A) Untransfected (control), BNIP3-T7 (BNIP3)- and BNIP3ΔTM-T7 (BNIP3ΔTM)-transfected 293T cells were harvested 24 h after transfection and incubated with calcein-AM in the presence of CoCl2 to quench cytoplasmic fluorescence. Cells were visualized by confocal laser microscopy (left) and Nomarski optics (right). (B) Quantitation of calcein fluorescence of cells transfected as described for panel A. The percentages of cells measured as low (CALCEINLO), intermediate (CALCEINMED), or high (CALCEINHI) total fluorescence units per cell are shown. The experiment was repeated with similar results. By chi analysis, P < 0.001 for the comparison of control versus BNIP3 and BNIP3ΔTM versus BNIP3. (C) Untransfected (control) and BNIP3-T7 (BNIP3)-, BNIP3ΔTM-T7 (ΔTM)-, or tBID-FLAG (tBID)-transfected 293T cells were harvested at 24 h, stained with JC-1, and analyzed by flow cytometry as a measure of Δψm. JC-1LO cells were defined as cells that were gated within the same range as those treated with 50 μM ClCCP (∼99%). BNIP3- and tBID- but not BNIP3ΔTM-transfected cells were significantly suppressed compared to controls (P < 0.01). (D) Cells treated as in panel C were stained with HE to measure ROS production. HEHI cells were defined as cells that were gated within the same range as those treated with 30% H2O2 for 15 min (∼98%). Levels in BNIP3- and tBID-expressing cells were significantly increased compared to untreated controls or BNIP3ΔTM (P < 0.03; the Student t test). (E) Samples from the control and each of the transfections in panel C were trypan blue stained as a measure of cell death. BNIP3- and tBID-transfected cells were significantly increased compared to untreated controls or BNIP3ΔTM (P < 0.01; the Student t test).
FIG. 10
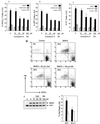
Inhibition of BNIP3-induced mitochondrial dysfunction and cell death by PT pore inhibitors and Bcl-2. Untransfected (control) and BNIP3-T7-transfected 293T cells harvested 8 h posttransfection were treated with increasing doses of cyclosporin A or 100 μM bongkrekic acid (BA) and stained with DiOC6 (A), HE (B), or PI (C) as described above. BNIP3ΔTM-T7-transfected 293T cells were used as a negative transfection control. Results are expressed as the mean ± SE for at least three independent experiments. (D) Flow cytometric histograms of HE and DiOC6 staining of BNIP3-transfected cells treated with 50 μM cyclosporin A (CsA) or 100 μM bongkrekic acid (BA). (E) Western blot of BNIP3-transfected cells treated as described above using anti-T7 epitope antibody. Antiactin antibody was used as a loading control. Suppression of DiOC6 levels in BNIP3 cells was significantly inhibited compared to BNIP3 cells at 25 μM (P < 0.05) and 50 μM (P < 0.02) cyclosporin A and 100 μM bongkrekic acid (P < 0.02). Increase in HE fluorescence was inhibited at 25 μM (P < 0.03) and 50 μM (P < 0.02) cyclosporin A and 100 μM bongkrekic acid (P < 0.02). Cell death was significantly suppressed at 50 μM cyclosporin A (P < 0.02), and 100 μM bongkrekic acid (P < 0.02). (F) BNIP3-induced cell death (solid bars) in 293T cells and 293 cells overexpressing BCL-2 (BCL-2) compared to the inactive BNIP3ΔTM mutant (open bars). Eight hours following BNIP3 transfection, cells were stained with PI and evaluated by flow cytometry. The percent dead cells were calculated as the proportion of cells that were PI positive. Equivalent transfection efficiency was obtained in both cell lines, as detected by immunostaining.
FIG. 11
Model of BNIP3-induced cell death. Overexpression permits integration of BNIP3 into the outer mitochondrial membrane in an Ncyto-Cin orientation through its TM domain. BNIP3 then initiates permeability transition pore opening and Δψm suppression with increased ROS production in an undefined sequence, leading to cell death. Late DNA fragmentation and chromatin condensation are also induced as a consequence of BNIP3 integration via an unidentified pathway.
Similar articles
- Mitochondrial cytochrome c release is caspase-dependent and does not involve mitochondrial permeability transition in didemnin B-induced apoptosis.
Grubb DR, Ly JD, Vaillant F, Johnson KL, Lawen A. Grubb DR, et al. Oncogene. 2001 Jul 5;20(30):4085-94. doi: 10.1038/sj.onc.1204545. Oncogene. 2001. PMID: 11494136 - Upregulation of BNIP3 and translocation to mitochondria mediates cyanide-induced apoptosis in cortical cells.
Prabhakaran K, Li L, Zhang L, Borowitz JL, Isom GE. Prabhakaran K, et al. Neuroscience. 2007 Nov 30;150(1):159-67. doi: 10.1016/j.neuroscience.2007.07.033. Epub 2007 Jul 29. Neuroscience. 2007. PMID: 17980495 Free PMC article. - The carboxy terminal C-tail of BNip3 is crucial in induction of mitochondrial permeability transition in isolated mitochondria.
Kim JY, Cho JJ, Ha J, Park JH. Kim JY, et al. Arch Biochem Biophys. 2002 Feb 15;398(2):147-52. doi: 10.1006/abbi.2001.2673. Arch Biochem Biophys. 2002. PMID: 11831844 - BNip3 and signal-specific programmed death in the heart.
Webster KA, Graham RM, Bishopric NH. Webster KA, et al. J Mol Cell Cardiol. 2005 Jan;38(1):35-45. doi: 10.1016/j.yjmcc.2004.11.007. Epub 2004 Dec 13. J Mol Cell Cardiol. 2005. PMID: 15623420 Review. - Bnip3 as a dual regulator of mitochondrial turnover and cell death in the myocardium.
Gustafsson AB. Gustafsson AB. Pediatr Cardiol. 2011 Mar;32(3):267-74. doi: 10.1007/s00246-010-9876-5. Epub 2011 Jan 6. Pediatr Cardiol. 2011. PMID: 21210091 Free PMC article. Review.
Cited by
- Cell death and survival through the endoplasmic reticulum-mitochondrial axis.
Bravo-Sagua R, Rodriguez AE, Kuzmicic J, Gutierrez T, Lopez-Crisosto C, Quiroga C, Díaz-Elizondo J, Chiong M, Gillette TG, Rothermel BA, Lavandero S. Bravo-Sagua R, et al. Curr Mol Med. 2013 Feb;13(2):317-29. doi: 10.2174/156652413804810781. Curr Mol Med. 2013. PMID: 23228132 Free PMC article. Review. - The SARS-CoV-2 spike glycoprotein interacts with MAO-B and impairs mitochondrial energetics.
Pileggi CA, Parmar G, Elkhatib H, Stewart CM, Alecu I, Côté M, Bennett SAL, Sandhu JK, Cuperlovic-Culf M, Harper ME. Pileggi CA, et al. Curr Res Neurobiol. 2023 Oct 6;5:100112. doi: 10.1016/j.crneur.2023.100112. eCollection 2023. Curr Res Neurobiol. 2023. PMID: 38020812 Free PMC article. - The ER membrane protein complex restricts mitophagy by controlling BNIP3 turnover.
Delgado JM, Shepard LW, Lamson SW, Liu SL, Shoemaker CJ. Delgado JM, et al. EMBO J. 2024 Jan;43(1):32-60. doi: 10.1038/s44318-023-00006-z. Epub 2023 Dec 15. EMBO J. 2024. PMID: 38177312 Free PMC article. - Hypoxia and acidosis activate cardiac myocyte death through the Bcl-2 family protein BNIP3.
Kubasiak LA, Hernandez OM, Bishopric NH, Webster KA. Kubasiak LA, et al. Proc Natl Acad Sci U S A. 2002 Oct 1;99(20):12825-30. doi: 10.1073/pnas.202474099. Epub 2002 Sep 11. Proc Natl Acad Sci U S A. 2002. PMID: 12226479 Free PMC article. - The BH3-only Bnip3 binds to the dynamin Opa1 to promote mitochondrial fragmentation and apoptosis by distinct mechanisms.
Landes T, Emorine LJ, Courilleau D, Rojo M, Belenguer P, Arnauné-Pelloquin L. Landes T, et al. EMBO Rep. 2010 Jun;11(6):459-65. doi: 10.1038/embor.2010.50. Epub 2010 Apr 30. EMBO Rep. 2010. PMID: 20436456 Free PMC article.
References
- Bernardi P, Scorrano L, Colonna R, Petronilli V, Di Lisa F. Mitochondria and cell death: mechanistic aspects and methodological issues. Eur J Biochem. 1999;264:687–701. - PubMed
- Boyd J M, Malstrom S, Subramanian T, Venkatesh L K, Schaeper U, Elangovan B, D'Sa-Eipper C, Chinnadurai G. Adenovirus E1B 19 kDa and Bcl-2 proteins interact with a common set of cellular proteins. Cell. 1994;79:341–351. - PubMed
- Chautan M, Chazal G, Cecconi F, Gruss P, Golstein P. Interdigital cell death can occur through a necrotic and caspase-independent pathway. Curr Biol. 1999;9:967–970. - PubMed
- Chen G, Cizeau J, Vande Velde C, Park J H, Bozek G, Bolton J, Shi L, Dubik D, Greenberg A. Nix and Nip3 form a subfamily of pro-apoptotic mitochondrial proteins. J Biol Chem. 1999;274:7–10. - PubMed
Publication types
MeSH terms
Substances
LinkOut - more resources
Full Text Sources
Other Literature Sources
Molecular Biology Databases
Research Materials


