Evaluation of two-dimensional gel electrophoresis-based proteome analysis technology - PubMed (original) (raw)
Evaluation of two-dimensional gel electrophoresis-based proteome analysis technology
S P Gygi et al. Proc Natl Acad Sci U S A. 2000.
Abstract
Proteome analysis is most commonly accomplished by a combination of two-dimensional gel electrophoresis (2DE) to separate and visualize proteins and mass spectrometry (MS) for protein identification. Although this technique is powerful, mature, and sensitive, questions remain concerning its ability to characterize all of the elements of a proteome. In the current study, more than 1,500 features were visualized by silver staining a narrow pH range (4.9-5. 7) 2D gel in which 0.5 mg of total soluble yeast protein was separated. Fifty spots migrating to a region of 4 cm(2) were subjected to MS protein identification. Despite the high sample load and extended electrophoretic separation, proteins from genes with codon bias values of <0.1 (lower abundance proteins) were not found, even though fully one-half of all yeast genes fall into that range. Proteins from genes with codon bias values of <0.1 were found, however, if protein amounts exceeding the capacity of 2DE were fractionated and analyzed. We conclude that the large range of protein expression levels limits the ability of the 2DE-MS approach to analyze proteins of medium to low abundance, and thus the potential of this technique for proteome analysis is likewise limited.
Figures
Figure 1
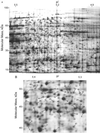
(A) Narrow pH range isoelectric focusing 2D gel (pH 4.9–5.5). Soluble yeast protein (500 μg) was loaded onto the gel. More than 1,500 features were visible by silver staining. (B) An arbitrary 4-cm2 region of the gel was selected for analysis. Numbers show the 50 spots that were identified by the MS techniques described in the text.
Figure 2
Codon bias value distributions in the yeast genome and on a narrow-range isoelectric focusing gel. (A) The entire yeast genome. (B) Genes predicted to run within selected area based on pI (5.25–5.45) and molecular mass (38–54 kDa). (C) Unique genes detected in selected area. (D) Genes both predicted and found. Codon bias value is a predictor of protein abundance with lower abundance proteins generally arising from genes with codon bias values <0.2. No low abundance proteins were detected with codon bias values <0.1 even though more than one-half of the proteins in yeast fall into this category.
Figure 3
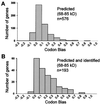
Low abundance proteins can be detected if the starting protein load is large. Fifty milligrams of soluble yeast protein was separated by SDS/PAGE in a single 10-cm wide lane. A band corresponding to a molecular mass range of 68 to 85 kDa was excised and in-gel trypsinized, and peptides were separated by strong cation exchange chromatography followed by on-line separation and analysis by LC-MS/MS techniques. Proteins in the gel band were identified from MS/MS spectra by the computer program
sequest(12). (
A) Distribution of codon bias for genes predicted to be between 68 and 85 kDa in molecular mass. This is a similar pattern as that shown in A, which shows the distribution for all yeast genes. (B) Distribution of codon bias for genes identified within the gel band. Many proteins from genes with low codon bias values (<0.1) were identified, including three protein kinases and a transcription factor.
Similar articles
- Proteome studies of Saccharomyces cerevisiae: identification and characterization of abundant proteins.
Garrels JI, McLaughlin CS, Warner JR, Futcher B, Latter GI, Kobayashi R, Schwender B, Volpe T, Anderson DS, Mesquita-Fuentes R, Payne WE. Garrels JI, et al. Electrophoresis. 1997 Aug;18(8):1347-60. doi: 10.1002/elps.1150180810. Electrophoresis. 1997. PMID: 9298649 - Quantitative proteome analysis: methods and applications.
Aebersold R, Rist B, Gygi SP. Aebersold R, et al. Ann N Y Acad Sci. 2000;919:33-47. doi: 10.1111/j.1749-6632.2000.tb06865.x. Ann N Y Acad Sci. 2000. PMID: 11083095 - Zooming-in on the proteome: very narrow-range immobilised pH gradients reveal more protein species and isoforms.
Westbrook JA, Yan JX, Wait R, Welson SY, Dunn MJ. Westbrook JA, et al. Electrophoresis. 2001 Aug;22(14):2865-71. doi: 10.1002/1522-2683(200108)22:14<2865::AID-ELPS2865>3.0.CO;2-Y. Electrophoresis. 2001. PMID: 11565781 Review. - Proteomics: the move to mixtures.
Peng J, Gygi SP. Peng J, et al. J Mass Spectrom. 2001 Oct;36(10):1083-91. doi: 10.1002/jms.229. J Mass Spectrom. 2001. PMID: 11747101 Review.
Cited by
- Current status and advances in quantitative proteomic mass spectrometry.
Wasinger VC, Zeng M, Yau Y. Wasinger VC, et al. Int J Proteomics. 2013;2013:180605. doi: 10.1155/2013/180605. Epub 2013 Mar 6. Int J Proteomics. 2013. PMID: 23533757 Free PMC article. - Proteome turnover in bacteria: current status for Corynebacterium glutamicum and related bacteria.
Trötschel C, Albaum SP, Poetsch A. Trötschel C, et al. Microb Biotechnol. 2013 Nov;6(6):708-19. doi: 10.1111/1751-7915.12035. Epub 2013 Feb 20. Microb Biotechnol. 2013. PMID: 23425033 Free PMC article. Review. - Comparison of first dimension IPG and NEPHGE techniques in two-dimensional gel electrophoresis experiment with cytosolic unfolded protein response in Saccharomyces cerevisiae.
Slibinskas R, Ražanskas R, Zinkevičiūtė R, Čiplys E. Slibinskas R, et al. Proteome Sci. 2013 Jul 27;11(1):36. doi: 10.1186/1477-5956-11-36. Proteome Sci. 2013. PMID: 23889826 Free PMC article. - Bioinformatics insights into acute lung injury/acute respiratory distress syndrome.
Fang X, Bai C, Wang X. Fang X, et al. Clin Transl Med. 2012 Jun 9;1(1):9. doi: 10.1186/2001-1326-1-9. Clin Transl Med. 2012. PMID: 23369517 Free PMC article. - Identification of protein complexes required for efficient sister chromatid cohesion.
Mayer ML, Pot I, Chang M, Xu H, Aneliunas V, Kwok T, Newitt R, Aebersold R, Boone C, Brown GW, Hieter P. Mayer ML, et al. Mol Biol Cell. 2004 Apr;15(4):1736-45. doi: 10.1091/mbc.e03-08-0619. Epub 2004 Jan 23. Mol Biol Cell. 2004. PMID: 14742714 Free PMC article.
References
- Velculescu V E, Zhang L, Vogelstein B, Kinzler K W. Science. 1995;270:484–487. - PubMed
Publication types
MeSH terms
Substances
Grants and funding
- T32HG00035/HG/NHGRI NIH HHS/United States
- T32 HG000035/HG/NHGRI NIH HHS/United States
- HG00041/HG/NHGRI NIH HHS/United States
- P41 RR011823/RR/NCRR NIH HHS/United States
- T32 HG000041/HG/NHGRI NIH HHS/United States
- K22 HG000041/HG/NHGRI NIH HHS/United States
- RR11823/RR/NCRR NIH HHS/United States
LinkOut - more resources
Full Text Sources
Other Literature Sources
Molecular Biology Databases


