EEA1, a tethering protein of the early sorting endosome, shows a polarized distribution in hippocampal neurons, epithelial cells, and fibroblasts - PubMed (original) (raw)
EEA1, a tethering protein of the early sorting endosome, shows a polarized distribution in hippocampal neurons, epithelial cells, and fibroblasts
J M Wilson et al. Mol Biol Cell. 2000 Aug.
Free PMC article
Abstract
EEA1 is an early endosomal Rab5 effector protein that has been implicated in the docking of incoming endocytic vesicles before fusion with early endosomes. Because of the presence of complex endosomal pathways in polarized and nonpolarized cells, we have examined the distribution of EEA1 in diverse cell types. Ultrastructural analysis demonstrates that EEA1 is present on a subdomain of the early sorting endosome but not on clathrin-coated vesicles, consistent with a role in providing directionality to early endosomal fusion. Furthermore, EEA1 is associated with filamentous material that extends from the cytoplasmic surface of the endosomal domain, which is also consistent with a tethering/docking role for EEA1. In polarized cells (Madin-Darby canine kidney cells and hippocampal neurons), EEA1 is present on a subset of "basolateral-type" endosomal compartments, suggesting that EEA1 regulates specific endocytic pathways. In both epithelial cells and fibroblastic cells, EEA1 and a transfected apical endosomal marker, endotubin, label distinct endosomal populations. Hence, there are at least two distinct sets of early endosomes in polarized and nonpolarized mammalian cells. EEA1 could provide specificity and directionality to fusion events occurring in a subset of these endosomes in polarized and nonpolarized cells.
Figures
Figure 1
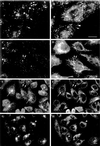
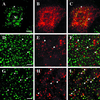
EEA1 is associated with the sorting endosomes of A431 and CHO cells. (A–D) Control or BFA-treated A431 cells were labeled for the transferrin receptor (B and D) and for EEA1 (A and C). EEA1 and transferrin receptor colocalize partially in the untreated cells (A and B, arrows), although some transferrin-positive structures are negative for EEA1 (B, arrowhead). After BFA treatment, the transferrin receptor–containing elements are converted into an extensive tubular system that runs throughout the cell (D). The EEA1 labeling remains as discrete puncta (C). The only colocalization with transferrin receptor–positive elements is at foci from which tubules appear to emanate (C and D, arrows). (E–H) CHO cells were incubated with FITC–transferrin for 30 min at 37°C and then labeled for EEA1. (E and G) FITC–transferrin; (F and H) EEA1 labeling. EEA1 is distributed throughout the CHO cells (F), and some colocalization with peripheral transferrin (G) is evident (F, small arrows). However, there is no colocalization with internalized transferrin labeling the pericentriolar recycling endosome (E and F, large arrows). In G and H, cells were incubated with transferrin as in E and then further incubated for 20 min at 37°C in the presence or absence of 5 μg/ml BFA. In the absence of BFA, the bulk of the FITC–transferrin labeling was lost, but in the presence of BFA, the transferrin remains within the pericentriolar region (G, arrowheads). EEA1 shows a redistribution toward the pericentriolar region but negligible overlap with pericentriolar transferrin (H). Bars, 10 μm.
Figure 2
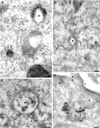
Immunoelectron microscopic localization of EEA1 in BHK and A431 cells. BHK (A and B) or A431 cells (C and D) were incubated with endocytic markers (BHK cells with 5 nm BSA–gold for 10 min at 37°C; A431 cells with 14 nm CT-B–gold) and then processed for frozen sectioning. Sections were labeled with antibodies to EEA1 followed by 10 nm protein A–gold. EEA1 labeling is predominantly associated with endosomal vacuoles (asterisks). (A) Labeling of two early endosomal vacuoles containing internalized 5 nm BSA–gold. Note that the labeling is clearly located at some distance from the membrane of the endosome in the cytoplasm (arrows). A putative late endosomal structure filled with internal membranes at the lower edge of the figure is unlabeled by EEA1. (B) Labeling for EEA1, which is in the area of the BSA–gold-labeled endosomal vacuole, but labeling is also associated with the tubular elements surrounding (and presumably emanating from) the endosomal vacuole (arrows). (C and D) CT-B–gold-labeled endosomes in A431 cells. (C) An extracted cell in which EEA1 labeling of the vacuole and associated membranes is particularly high. Arrowheads indicate internalized CT-B–gold. (D) An endosome with particularly high CT-B–gold labeling. EEA1 (arrows) is associated with the CT-B–gold-labeled structure. Also note the labeling of surface caveolae by the CT-B–gold (arrowheads). P, plasma membrane. Bars, 100 nm.
Figure 3
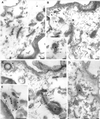
Immunoelectron microscopic localization of EEA1 in MDCK cells. MDCK cells grown on polycarbonate filters were perforated with the use of nitrocellulose to remove parts of the apical surface. Cells were labeled for EEA1, fixed, and processed for Epon embedding with the use of tannic acid to increase staining of cytoplasmic coat proteins. All images show areas underlying the apical plasma membrane. Labeling for EEA1 (arrows) is associated with both tubular structures (A, B, C, and E) and vesicular elements (asterisks in C, D, and B inset) of the endocytic system. Mitochondria (M), Golgi (G), and other membranes are completely unlabeled. In addition, the plasma membrane (P) and clathrin-coated pits and vesicles (arrowheads in B and C; note clathrin lattice in B) are invariably completely negative for EEA1. EEA1 labeling is apparent on filamentous material surrounding the membrane compartments, particularly in B, C, and E. This filamentous material does not contain actin, as shown by double labeling for actin (A in panel B indicates anti-actin 5 nm gold labeling; arrows indicate 10 nm anti-EEA1 labeling). T, tight junction. Bars, 100 nm.
Figure 4
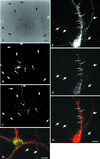
EEA1 is restricted to somatodendritic endosomes in neurons. (A–C) A mature hippocampal neuron by phase contrast (A) and stained for EEA1 (B) and MAP2 (C). The EEA1-positive endosomes (B) can be detected only in the dendrites (small arrows) identified by the presence of MAP2 (C). The large arrows mark the axons, visible in the phase-contrast image (A), that are MAP2 negative and that show no EEA1-positive staining. (D) An overlaid image of a different neuron showing that EEA1 (green) is present in MAP2-positive processes (red). Bar, 10 μm.
Figure 5
EEA1 is undetectable in axonal endosomes but colocalizes with Rab5 in somatodendritic endosomes. (A–D) Nerve terminals and varicosities of mature hippocampal neurons were labeled by a 30-min incubation with rabbit antibodies against synaptotagmin. (A–C) A mature hippocampal neuron by phase contrast (A) and stained for EEA1 (B) and internalized synaptotagmin (C). Dot-like synaptotagmin-positive structures are present all along the thin axons (C, large arrows). EEA1 labeling is present in processes that do not contain synaptotagmin labeling (small arrows). (D) A merged image of a different neuron showing the labeling pattern of EEA1 (green) and synaptotagmin (red). There is no colocalization of the two markers (arrows indicate EEA1-negative, synaptotagmin-positive processes). (E–G) Mature neurons were labeled for Rab5 (E) and for EEA1 (F); the overlay of Rab5 (red) and EEA1 (green) is shown in G. Small arrows indicate Rab5- and EEA1-positive somatodendritic endosomes; large arrows indicate axons containing Rab5-positive, EEA1-negative endosomes. Bars, 10 μm.
Figure 6
EEA1 is depleted from purified synaptosomes. Synaptosomes (pinched-off nerve terminals) were isolated from rat brain, and fractions from the brain homogenate (H), 10-min 100 ×g pellet (P), 10-min 1000 × g supernatant (S), and the synaptosomes (SS) were analyzed by Western blotting (A–D) with the use of antibodies against MAP2 (A and E), synaptophysin (B and F), EEA1 (human antiserum from patient 1; C and G), and EEA1 (human antiserum from patient 2; D and H). Sizes of molecular mass markers are indicated on the right. Note that 50 μg of protein was loaded in lanes H, S, and P, whereas only 25 μg of protein was loaded in lane SS. Blots were quantified as described in MATERIALS AND METHODS (E–H). The total amount of material (based on an equal amount of protein) loaded in all four lanes is considered to be 100%. Bars indicate the relative amount present in each fraction.
Figure 7
EEA1 labels a subset of endosomes in MDCK cells. MDCK cells that had been transfected with the apical endosomal marker endotubin were incubated with cycloheximide for 1 h at 37°C, fixed, and labeled with antibodies against EEA1 (A, arrows) and endotubin (B). The endotubin is present in a fine reticular network, whereas the EEA1 is present in punctate structures. There is little colocalization of the two markers (C, merged image). (D–I) Fluid-phase uptake in MDCK cells grown on filters. MDCK cells grown on filters were incubated with 10 mg/ml ovalbumin–Texas Red for 15 min at 37°C in the apical (D–F) or basolateral (G–I) chamber. The cells were fixed and labeled with anti-EEA1. For visualization of both EEA1 and ovalbumin, panels D–F show composites of three stacked images. EEA1 labeling (arrows in D, F, G, and I) is present in distinct ring-shaped structures. After apical uptake of fluid-phase marker (arrowheads in E and F), there is no colocalization of tracer and EEA1 labeling (F, merged image). Uptake of ovalbumin–Texas Red from the basolateral side (G–I) results in extensive colocalization of the markers, and the ovalbumin–Texas Red (arrowheads in H and I) fills the EEA1-positive rings (arrows in G and I) The images shown in panels G–I are from a single optical section. Bars, 5 μm.
Figure 8
EEA1 and expressed endotubin label distinct endosomal populations in NRK cells. NRK cells were transfected with endotubin and after 24 h were labeled for EEA1 (A and D) and endotubin (B and E). The two markers label distinct endosomal elements, as shown in the overlays (C and F). This is particularly evident in peripheral areas of the cell (C, arrows), which contain endotubin-positive elements and no EEA1. The EEA1 and endotubin staining in the central area of the transfected cell in panels A–C is shown in panels D and E, respectively. Note the general lack of colocalization despite the close proximity of labeled elements. Bars, 10 μ m.
Similar articles
- Targeting of an intestinal apical endosomal protein to endosomes in nonpolarized cells.
Wilson JM, Colton TL. Wilson JM, et al. J Cell Biol. 1997 Jan 27;136(2):319-30. doi: 10.1083/jcb.136.2.319. J Cell Biol. 1997. PMID: 9015303 Free PMC article. - Involvement of the endosomal autoantigen EEA1 in homotypic fusion of early endosomes.
Mills IG, Jones AT, Clague MJ. Mills IG, et al. Curr Biol. 1998 Jul 16;8(15):881-4. doi: 10.1016/s0960-9822(07)00351-x. Curr Biol. 1998. PMID: 9705936 - Selective membrane recruitment of EEA1 suggests a role in directional transport of clathrin-coated vesicles to early endosomes.
Rubino M, Miaczynska M, Lippé R, Zerial M. Rubino M, et al. J Biol Chem. 2000 Feb 11;275(6):3745-8. doi: 10.1074/jbc.275.6.3745. J Biol Chem. 2000. PMID: 10660521 - Retromer and Its Role in Regulating Signaling at Endosomes.
Seaman MNJ. Seaman MNJ. Prog Mol Subcell Biol. 2018;57:137-149. doi: 10.1007/978-3-319-96704-2_5. Prog Mol Subcell Biol. 2018. PMID: 30097774 Review. - Spatial regulation of endosomes in growing dendrites.
Yap CC, Winckler B. Yap CC, et al. Dev Biol. 2022 Jun;486:5-14. doi: 10.1016/j.ydbio.2022.03.004. Epub 2022 Mar 17. Dev Biol. 2022. PMID: 35306006 Free PMC article. Review.
Cited by
- Defective Transcytosis of APP and Lipoproteins in Human iPSC-Derived Neurons with Familial Alzheimer's Disease Mutations.
Woodruff G, Reyna SM, Dunlap M, Van Der Kant R, Callender JA, Young JE, Roberts EA, Goldstein LS. Woodruff G, et al. Cell Rep. 2016 Oct 11;17(3):759-773. doi: 10.1016/j.celrep.2016.09.034. Cell Rep. 2016. PMID: 27732852 Free PMC article. - Cofilin aggregation blocks intracellular trafficking and induces synaptic loss in hippocampal neurons.
Cichon J, Sun C, Chen B, Jiang M, Chen XA, Sun Y, Wang Y, Chen G. Cichon J, et al. J Biol Chem. 2012 Feb 3;287(6):3919-29. doi: 10.1074/jbc.M111.301911. Epub 2011 Dec 19. J Biol Chem. 2012. PMID: 22184127 Free PMC article. - The neurotrophin receptor signaling endosome: Where trafficking meets signaling.
Barford K, Deppmann C, Winckler B. Barford K, et al. Dev Neurobiol. 2017 Apr;77(4):405-418. doi: 10.1002/dneu.22427. Epub 2017 Feb 24. Dev Neurobiol. 2017. PMID: 27503831 Free PMC article. Review. - Roles of membrane trafficking in nerve repair and regeneration.
Tuck E, Cavalli V. Tuck E, et al. Commun Integr Biol. 2010 May;3(3):209-14. doi: 10.4161/cib.3.3.11555. Commun Integr Biol. 2010. PMID: 20714395 Free PMC article. - Phagocytosis and intracellular fate of Aspergillus fumigatus conidia in alveolar macrophages.
Ibrahim-Granet O, Philippe B, Boleti H, Boisvieux-Ulrich E, Grenet D, Stern M, Latgé JP. Ibrahim-Granet O, et al. Infect Immun. 2003 Feb;71(2):891-903. doi: 10.1128/IAI.71.2.891-903.2003. Infect Immun. 2003. PMID: 12540571 Free PMC article.
References
- Bomsel M, Parton RG, Kuznetsov A, Schroer TA, Gruenberg J. Microtubule- and motor-dependent fusion in vitro between apical and basolateral endocytic vesicles from MDCK cells. Cell. 1990;62:719–731. - PubMed
Publication types
MeSH terms
Substances
LinkOut - more resources
Full Text Sources
Molecular Biology Databases
Miscellaneous
