Transgenic overexpression of caveolin-3 in skeletal muscle fibers induces a Duchenne-like muscular dystrophy phenotype - PubMed (original) (raw)
. 2000 Aug 15;97(17):9689-94.
doi: 10.1073/pnas.160249097.
D Volonte, J B Chu, M Li, S W Fine, M Fu, J Bermudez, M Pedemonte, K M Weidenheim, R G Pestell, C Minetti, M P Lisanti
Affiliations
- PMID: 10931944
- PMCID: PMC16926
- DOI: 10.1073/pnas.160249097
Transgenic overexpression of caveolin-3 in skeletal muscle fibers induces a Duchenne-like muscular dystrophy phenotype
F Galbiati et al. Proc Natl Acad Sci U S A. 2000.
Abstract
It recently was reported that Duchenne muscular dystrophy (DMD) patients and mdx mice have elevated levels of caveolin-3 expression in their skeletal muscle. However, it remains unknown whether increased caveolin-3 levels in DMD patients contribute to the pathogenesis of DMD. Here, using a genetic approach, we test this hypothesis directly by overexpressing wild-type caveolin-3 as a transgene in mice. Analysis of skeletal muscle tissue from caveolin-3- overexpressing transgenic mice reveals: (i) a dramatic increase in the number of sarcolemmal muscle cell caveolae; (ii) a preponderance of hypertrophic, necrotic, and immature/regenerating skeletal muscle fibers with characteristic central nuclei; and (iii) down-regulation of dystrophin and beta-dystroglycan protein expression. In addition, these mice show elevated serum creatine kinase levels, consistent with the myo-necrosis observed morphologically. The Duchenne-like phenotype of caveolin-3 transgenic mice will provide an important mouse model for understanding the pathogenesis of DMD in humans.
Figures
Figure 1
Construction and expression of a transgenic vector encoding caveolin-3. (A) The caveolin-3 transgenic expression cassette_._ The full-length untagged cDNA encoding caveolin-3 was subcloned into the expression vector pCAGGS. Note that in the pCAGGS-Cav-3 construct, the CMV enhancer and the chicken β-actin promoter sequence are located upstream the caveolin-3 cDNA, whereas the rabbit β-globin poly(A) sequence is located downstream of the caveolin-3 cDNA. The CMV enhancer/β-actin promoter sequences are expected to drive constitutive expression of caveolin-3 in a wide variety of tissue types. (B) Western blot analysis. The expression of caveolin-3 in normal control mice (CTL) and caveolin-3 transgenic mice (CAV-3) is shown. Protein lysates were prepared from a variety of mouse tissues. Immunoblotting was performed with a mono-specific antibody probe that recognizes only caveolin-3 (mAb 26). Note that in normal control mice caveolin-3 is expressed only in heart and skeletal muscle. In contrast, caveolin-3 transgenic mice express caveolin-3 in all tissues examined and demonstrate elevated levels of caveolin-3 in heart and skeletal muscle. Each lane contains an equal amount of total protein.
Figure 2
Immunohistochemical analysis of the tissue distribution of caveolin-3 in normal control mice and caveolin-3 (Cav-3) transgenic mice. Paraffin-embedded tissue sections were prepared and immunostained with anti-caveolin-3 IgG. After extensive washing, bound primary antibodies were visualized by using a peroxidase-based detection method (see Materials and Methods). Note that in normal control mice, caveolin-3 expression is essentially confined to striated muscle tissues [skeletal muscle (A) and heart (B)]. In contrast, in caveolin-3 transgenic mice, caveolin-3 is widely expressed in a variety of different tissues: kidney, fat (C); liver, brain (D); lung, spleen (E). In skeletal muscle (A) and in the heart (B), note that caveolin-3 transgenic mice exhibit overexpression of caveolin-3 when compared with the endogenous expression observed in normal control mice.
Figure 3
Up-regulation of skeletal muscle caveolae organelles in caveolin-3 (Cav-3) transgenic mice. Transmission electron micrographs of skeletal muscle tissue sections from normal control mice and caveolin-3 transgenic mice are shown. Note that overexpression of caveolin-3 in the transgenic mice (Right) results in the formation of an increased number of caveolae when compared with normal control mice (Left).
Figure 4
Histological and histochemical analysis of skeletal muscle fibers from caveolin-3 (Cav-3) transgenic mice. Muscle tissue sections from normal control mice (Left) and caveolin-3 transgenic mice (Right) were stained with hematoxylin and eosin (H&E) (Top), modified Gomori's trichrome (Middle), or NADH-tetrazolium reductase (Bottom). Note that muscle tissue sections from caveolin-3 transgenic mice exhibit dramatic variability in the size of muscle fibers, an elevated number of necrotic fibers and regenerating muscle fibers (i.e., fibers with centrally located nuclei), and significant proliferation of connective tissue.
Figure 5
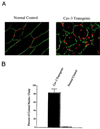
Caveolin-3 (Cav-3) transgenic mice exhibit an elevated number of skeletal muscle fibers with centrally located nuclei. (A) Immunocytochemistry_._ Skeletal muscle tissue sections from normal control mice (Left) and caveolin-3 transgenic mice (Right) were immunostained with anti-caveolin-3 IgG to reveal the muscle fiber sarcolemma (plasma membrane) and counterstained with propidium iodide to visualize the nuclei. The resulting merged images are shown to better allow visualization of the position of the nuclei with respect to the plasma membrane. (B) Quantitation of central nucleation_._ The number of muscle fibers with central nuclei is represented as percentage of the total muscle fibers analyzed. Note that in caveolin-3 transgenic mice ≈82% of the muscle fibers contain central nuclei, whereas ≈0.5% of muscle fibers from normal control mice exhibit central nuclei. These values were determined by examining the morphology of muscle fibers from > 30 different fields.
Figure 6
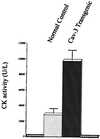
Caveolin-3 (Cav-3) transgenic mice have elevated levels of serum creatine kinase (CK), consistent with myo-necrosis. Creatine kinase activity was measured in serum from normal control mice and caveolin-3 transgenic mice by using a standard colorimetric assay. Note that caveolin-3 transgenic mice exhibit elevated serum creatine kinase activity (≈4- to 5-fold), as compared with normal control mice. Values represent the average of eight measurements (performed in duplicate) from four different control mice and four different caveolin-3 transgenic mice.
Figure 7
Down-regulation of dystrophin and β-dystroglycan in skeletal muscle tissue from caveolin-3 (Cav-3) transgenic mice. (A) Western blot analysis_._ Protein lysates of skeletal muscle tissue were prepared from normal control mice and caveolin-3 transgenic mice. After SDS/PAGE and transfer to nitrocellulose, immunoblotting was performed with monospecific antibodies directed against caveolin-3, dystrophin, and β-dystroglycan. Note that expression of dystrophin and β-dystroglycan is dramatically reduced in skeletal muscle from caveolin-3 transgenic mice. Each lane contains an equal amount of total protein. Visual inspection of the Ponceau S-stained blot of these muscle lysates was used to confirm equal protein loading. Note that the overall pattern of the proteins expressed does not change in caveolin-3 transgenics. (B) Immunocytochemistry_._ Skeletal muscle tissue sections were prepared from normal control mice (Left) and caveolin-3 transgenic mice (Right). After immuno-staining with antibodies directed against caveolin-3 (Top), dystrophin (Middle), and β-dystroglycan (Bottom), samples were observed under a confocal microscope. Note that β-dystroglycan and dystrophin are expressed at significantly lower levels in caveolin-3 transgenic mice.
Figure 8
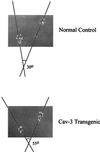
External rotation of the hind paws in caveolin-3 (Cav-3) transgenic mice. Note that the hind paws of caveolin-3 transgenic mice are externally rotated as compared with normal controls. No bony abnormalities were observed (not shown). A representative footprint pattern from a normal and caveolin-3 transgenic mouse are shown.
Similar articles
- Transgenic overexpression of dystroglycan does not inhibit muscular dystrophy in mdx mice.
Hoyte K, Jayasinha V, Xia B, Martin PT. Hoyte K, et al. Am J Pathol. 2004 Feb;164(2):711-8. doi: 10.1016/S0002-9440(10)63158-6. Am J Pathol. 2004. PMID: 14742274 Free PMC article. - Enhanced expression of the alpha 7 beta 1 integrin reduces muscular dystrophy and restores viability in dystrophic mice.
Burkin DJ, Wallace GQ, Nicol KJ, Kaufman DJ, Kaufman SJ. Burkin DJ, et al. J Cell Biol. 2001 Mar 19;152(6):1207-18. doi: 10.1083/jcb.152.6.1207. J Cell Biol. 2001. PMID: 11257121 Free PMC article. - Expression of caveolin-3 in skeletal, cardiac, and smooth muscle cells. Caveolin-3 is a component of the sarcolemma and co-fractionates with dystrophin and dystrophin-associated glycoproteins.
Song KS, Scherer PE, Tang Z, Okamoto T, Li S, Chafel M, Chu C, Kohtz DS, Lisanti MP. Song KS, et al. J Biol Chem. 1996 Jun 21;271(25):15160-5. doi: 10.1074/jbc.271.25.15160. J Biol Chem. 1996. PMID: 8663016 - The role of branched fibres in the pathogenesis of Duchenne muscular dystrophy.
Chan S, Head SI. Chan S, et al. Exp Physiol. 2011 Jun;96(6):564-71. doi: 10.1113/expphysiol.2010.056713. Epub 2011 Mar 18. Exp Physiol. 2011. PMID: 21421700 Review. - Dystrophin and utrophin: genetic analyses of their role in skeletal muscle.
Rafael JA, Brown SC. Rafael JA, et al. Microsc Res Tech. 2000 Feb 1-15;48(3-4):155-66. doi: 10.1002/(SICI)1097-0029(20000201/15)48:3/4<155::AID-JEMT4>3.0.CO;2-0. Microsc Res Tech. 2000. PMID: 10679963 Review.
Cited by
- Cholesterol removal from adult skeletal muscle impairs excitation-contraction coupling and aging reduces caveolin-3 and alters the expression of other triadic proteins.
Barrientos G, Llanos P, Hidalgo J, Bolaños P, Caputo C, Riquelme A, Sánchez G, Quest AF, Hidalgo C. Barrientos G, et al. Front Physiol. 2015 Apr 10;6:105. doi: 10.3389/fphys.2015.00105. eCollection 2015. Front Physiol. 2015. PMID: 25914646 Free PMC article. - Genetically Encoded Biosensors Reveal PKA Hyperphosphorylation on the Myofilaments in Rabbit Heart Failure.
Barbagallo F, Xu B, Reddy GR, West T, Wang Q, Fu Q, Li M, Shi Q, Ginsburg KS, Ferrier W, Isidori AM, Naro F, Patel HH, Bossuyt J, Bers D, Xiang YK. Barbagallo F, et al. Circ Res. 2016 Sep 30;119(8):931-43. doi: 10.1161/CIRCRESAHA.116.308964. Epub 2016 Aug 30. Circ Res. 2016. PMID: 27576469 Free PMC article. - Spatial and temporal regulation of GLUT4 translocation by flotillin-1 and caveolin-3 in skeletal muscle cells.
Fecchi K, Volonte D, Hezel MP, Schmeck K, Galbiati F. Fecchi K, et al. FASEB J. 2006 Apr;20(6):705-7. doi: 10.1096/fj.05-4661fje. Epub 2006 Feb 2. FASEB J. 2006. PMID: 16455755 Free PMC article. - Simultaneous dystrophin and dysferlin deficiencies associated with high-level expression of the coxsackie and adenovirus receptor in transgenic mice.
Shaw CA, Larochelle N, Dudley RW, Lochmuller H, Danialou G, Petrof BJ, Karpati G, Holland PC, Nalbantoglu J. Shaw CA, et al. Am J Pathol. 2006 Dec;169(6):2148-60. doi: 10.2353/ajpath.2006.060570. Am J Pathol. 2006. PMID: 17148677 Free PMC article. - Impaired signaling for neuromuscular synaptic maintenance is a feature of Motor Neuron Disease.
Ding Q, Kesavan K, Lee KM, Wimberger E, Robertson T, Gill M, Power D, Chang J, Fard AT, Mar JC, Henderson RD, Heggie S, McCombe PA, Jeffree RL, Colditz MJ, Hilliard MA, Ng DCH, Steyn FJ, Phillips WD, Wolvetang EJ, Ngo ST, Noakes PG. Ding Q, et al. Acta Neuropathol Commun. 2022 Apr 25;10(1):61. doi: 10.1186/s40478-022-01360-5. Acta Neuropathol Commun. 2022. PMID: 35468848 Free PMC article.
References
- Lisanti M P, Scherer P, Tang Z-L, Sargiacomo M. Trends Cell Biol. 1994;4:231–235. - PubMed
- Couet J, Li S, Okamoto T, Scherer P S, Lisanti M P. Trends Cardiovasc Med. 1997;7:103–110. - PubMed
- Okamoto T, Schlegel A, Scherer P E, Lisanti M P. J Biol Chem. 1998;273:5419–5422. - PubMed
Publication types
MeSH terms
Substances
LinkOut - more resources
Full Text Sources
Other Literature Sources
Molecular Biology Databases


