Regional difference in susceptibility to lipopolysaccharide-induced neurotoxicity in the rat brain: role of microglia - PubMed (original) (raw)
Regional difference in susceptibility to lipopolysaccharide-induced neurotoxicity in the rat brain: role of microglia
W G Kim et al. J Neurosci. 2000.
Abstract
Inflammation in the brain has been increasingly associated with the development of a number of neurological diseases. The hallmark of neuroinflammation is the activation of microglia, the resident brain immune cells. Injection of bacterial endotoxin lipopolysaccharide (LPS) into the hippocampus, cortex, or substantia nigra of adult rats produced neurodegeneration only in the substantia nigra. Although LPS appeared to impact upon mesencephalic neurons in general, an extensive loss of dopaminergic neurons was observed. Analysis of the abundance of microglia revealed that the substantia nigra had the highest density of microglia. When mixed neuron-glia cultures derived from the rat hippocampus, cortex, or mesencephalon were treated with LPS, mesencephalic cultures became sensitive to LPS at a concentration as low as 10 ng/ml and responded in a dose-dependent manner with the production of inflammatory factors and a loss of dopaminergic and other neurons. In contrast, hippocampal or cortical cultures remained insensitive to LPS treatment at concentrations as high as 10 microg/ml. Consistent with in vivo observations, mesencephalic cultures had fourfold to eightfold more microglia than cultures from other regions. The positive correlation between abundance of microglia and sensitivity to LPS-induced neurotoxicity was further supported by the observation that supplementation with enriched microglia derived from mesencephalon or cortex rendered LPS-insensitive cortical neuron-glia cultures sensitive to LPS-induced neurotoxicity. These data indicate that the region-specific differential susceptibility of neurons to LPS is attributable to differences in the number of microglia present within the system and may reflect levels of inflammation-related factors produced by these cells.
Figures
Fig. 1.
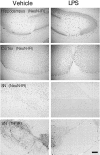
Susceptibility of neurons to LPS-induced toxicity in different rat brain regions. LPS was injected unilaterally into the adult rat hippocampus, cortex, or SN, and vehicle alone was injected contralaterally into the specific regions. The hippocampus or cortex received 10 μg of LPS, whereas the SN received 5 μg of LPS. After 7 d, the brains were removed, and tissue sections through the areas of interest were immunostained for neuronal proteins. Neurons in all regions were immunostained with an antibody against NeuN. Dopaminergic neurons in the SN were stained with an anti-TH antibody. At least six animals were used for each injection, and similar results were obtained in all animals examined. Scale bar, 250 μm.
Fig. 2.
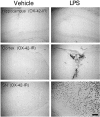
Abundance of microglia in different rat brain regions and responsiveness to LPS. LPS or vehicle was injected into the adult rat hippocampus, cortex, or SN as described in the legend to Figure 1. After 7 d, the brains were removed, and tissue sections through the areas of interest were immunostained for CR3 complement receptors using the monoclonal antibody OX-42 as a marker for microglia. At least six animals were used for each injection, and similar results were obtained in all animals examined. Scale bar, 250 μm.
Fig. 3.
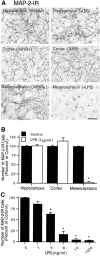
Differential neurotoxicity in mixed neuron–glia cultures from various brain regions after treatment with LPS. Mixed neuron–glia cultures were prepared from hippocampal, cortical, or mesencephalic tissues of embryonic day 16–17 rats. Cultures were treated for 72 hr with vehicle alone or 1 μg/ml LPS (A, B) or graded concentrations of LPS (C) and then immunostained with an antibody to the neuronal cytoskeletal protein MAP-2. A, Immunocytochemical analysis of MAP-2-positive neurons. Scale bar, 100 μm. B, Quantification of MAP-2-immunostained cell bodies. Significant degeneration of MAP-2-IR neurons after LPS treatment was observed in mesencephalic cultures only. For reference, the mean number of MAP-2-IR cells per well in the vehicle-treated hippocampal, cortical, and mesencephalic cultures were 6.7 × 10⁴, 6.0 × 10⁴, and 6.4 × 10⁴, respectively. C, LPS-induced loss of MAP-2-positive neurons in the mesencephalic cultures was dependent on the concentrations of LPS. The data are expressed as a percent of the total number of MAP-2-IR cell bodies present in the vehicle-treated control cultures. The data represent the mean ± SEM of at least five wells taken from three independent experiments. *p < 0.0001 compared with the vehicle-treated control cultures prepared from the rat mesencephalon.
Fig. 4.
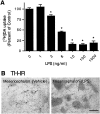
Effect of LPS on [3H]dopamine uptake and TH-IR neurons in mesencephalic neuron–glia cultures.A, Mesencephalic cultures were treated with either vehicle alone or the indicated concentrations of LPS for 72 hr, and the uptake of [3H]dopamine was assessed. The data are expressed as a percent of the dopamine uptake (minus nonspecific uptake, as determined in the presence of 10 μ
m
mazindol) measured after treatment with the vehicle alone and represent the mean ± SEM of six wells per condition. Duplicate experiments yielded similar qualitative results. *p < 0.01 compared with the vehicle-treated control cultures. B, Immunocytochemical analysis of dopaminergic neurons. Cultures treated for 72 hr with vehicle alone or 1000 ng/ml LPS were immunostained with an anti-TH antibody. A significant loss of TH-positive neurons was induced by LPS treatment, and the remaining TH-positive neurons had significantly shorter neurites.
Fig. 5.
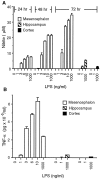
Effect of LPS on the production of NO and the release of TNFα in neuron–glia cultures derived from different brain regions. A, NO production. Mesencephalic neuron–glia cultures were treated with vehicle or the indicated concentrations of LPS, and the levels of NO production, assessed as the accumulation of nitrite, were quantified 24, 48, or 72 hr later. For comparison, the levels of NO production in hippocampal or cortical neuron–glia cultures treated with either vehicle or 1 or 1000 ng/ml LPS were measured at 72 hr. The data represent the mean ± SEM of 3–12 wells per condition. B, TNFα release. Mesencephalic neuron–glia cultures were treated with vehicle or indicated concentrations of LPS, and the levels of TNFα release were measured 6 hr later. For comparison, the levels of TNFα release in neuron–glia cultures derived from the rat hippocampus or cortex were also measured after stimulation with vehicle or 1 or 1000 ng/ml LPS. The data represent the mean ± SEM of three wells per condition. Duplicate experiments yielded similar qualitative results, although the levels of TNFα release varied between experiments.
Fig. 6.
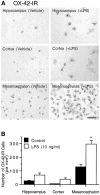
Abundance and responsiveness to LPS of cultured microglial cells derived from different brain regions. Neuron–glia cultures originated from rat hippocampus, cortex, or mesencephalon were treated with 10 ng/ml LPS for 72 hr and then immunostained with the OX-42 antibody. A, Immunocytochemical analysis of microglia. A significantly greater density of microglia was detected in both the vehicle and LPS-treated mesencephalic cultures compared with the hippocampal or cortical counterparts. Scale bar, 100 μm.B, Quantification of OX-42-immunostained cell bodies in hippocampal, cortical, or mesencephalic neuron–glia cultures. The data are expressed as the number of OX-42-IR cells per square millimeter and represent the mean ± SEM of at least three wells. *p < 0.0001 compared with the corresponding vehicle-treated control cultures, as determined by the Student's_t_ test.
Fig. 7.
Addition of microglia to LPS-insensitive cortical neuron–glia cultures rendered cortical neurons susceptible to LPS-induced toxicity. Neuron–glia cultures derived from rat cortex were cultured alone or together with microglia (105) derived from either the cortex or mesencephalon and then were treated with vehicle or 10 ng/ml LPS for 72 hr. A, Quantification of the number of MAP-2-IR neurons. B, TNFα release measured at 72 hr after treatment of cultures with 10 ng/ml LPS. C, NO production at 72 hr after treatment. *p < 0.0001 compared with the corresponding vehicle-treated control cultures, as determined by the Student's_t_ test. ND, not detected.
References
- Arditi M, Manogue KR, Caplan M, Yogev R. Cerebrospinal fluid cachectin/tumor necrosis factor-α and platelet-activating factor concentrations and severity of bacterial meningitis in children. J Infect Dis. 1990;162:139–147. - PubMed
- Boje KM, Arora PK. Microglia-produced nitric oxide and reactive nitrogen oxides mediate neuronal cell death. Brain Res. 1992;587:250–256. - PubMed
- Bronstein DM, Perez-Otano I, Sun V, Mullis Sawin SB, Chan J, Wu G-C, Hudson PM, Kong L-Y, Hong J-S, McMillian MK. Glia-dependent neurotoxicity and neuroprotection in mesencephalic cultures. Brain Res. 1995;704:112–116. - PubMed
- Brosnan CF, Battistini L, Raine CS, Dickson DW, Casadevall A, Lee SC. Reactive nitrogen intermediates in human neuropathology: an overview. Dev Neurosci. 1994;16:152–161. - PubMed
MeSH terms
Substances
LinkOut - more resources
Full Text Sources
Other Literature Sources
