Targeted disruption of the mPer3 gene: subtle effects on circadian clock function - PubMed (original) (raw)
Targeted disruption of the mPer3 gene: subtle effects on circadian clock function
L P Shearman et al. Mol Cell Biol. 2000 Sep.
Abstract
Neurons in the mammalian suprachiasmatic nucleus (SCN) contain a cell-autonomous circadian clock that is based on a transcriptional-translational feedback loop. The basic helix-loop-helix-PAS proteins CLOCK and BMAL1 are positive regulators and drive the expression of the negative regulators CRY1 and CRY2, as well as PER1, PER2, and PER3. To assess the role of mouse PER3 (mPER3) in the circadian timing system, we generated mice with a targeted disruption of the mPer3 gene. Western blot analysis confirmed the absence of mPER3-immunoreactive proteins in mice homozygous for the targeted allele. mPer1, mPer2, mCry1, and Bmal1 RNA rhythms in the SCN did not differ between mPER3-deficient and wild-type mice. Rhythmic expression of mPer1 and mPer2 RNAs in skeletal muscle also did not differ between mPER3-deficient and wild-type mice. mPer3 transcripts were rhythmically expressed in the SCN and skeletal muscle of mice homozygous for the targeted allele, but the level of expression of the mutant transcript was lower than that in wild-type controls. Locomotor activity rhythms in mPER3-deficient mice were grossly normal, but the circadian cycle length was significantly (0.5 h) shorter than that in controls. The results demonstrate that mPer3 is not necessary for circadian rhythms in mice.
Figures
FIG. 1
mPer3 targeting construct and genotyping strategies. (A) Schematic representation of the mPer3 gene, the targeting construct, and the targeted allele. A 1.6-kb portion of the mPer3 gene was excised with _Eco_RI (R1), and a PGK-NEO cassette was inserted in the reverse orientation. The 5′ and 3′ arms of the targeting construct were ca. 6 and 9 kb, respectively. Restriction sites introduced by the PGK-NEO cassette and used for Southern blot analysis were _Eco_RV (R5) and _Spe_I (S). Intron and exon structure is shown only for the first five exons (E1 to E5). Boxes represent exons, and the lines between the boxes indicate introns. Open boxes represent untranslated regions. Filled boxes represent putative coding regions based on translation from the first ATG with a Kozak consensus sequence at nt 358 of AF050182. (A second Kozak consensus sequence present in exon 2 could begin translation at nt 523). Horizontal filled boxes indicate the locations of probes used for Southern blotting. (B) Southern blot identification of the targeting event in ES cells. Representative autoradiograms are shown. The upper band in each case represents the wild-type allele, and the lower band represents the targeted allele (see panel A). (C) Southern blot analysis of DNA extracted from mouse tails. Genotypes are shown above lanes. (D) PCR genotyping of DNA extracted from mouse tails. Genotypes are shown above lanes. M, size marker (pUC19 _Dde_I with bands at 910, 540, 426, 409, 266, and 166 bp).
FIG. 2
mPER3 protein is absent in mice with targeted disruption of the mPer3 gene. (A) Western blot incubated with antisera to mPER3 showing immunoreactive proteins from wild-type (+/+) and mPER3-deficient (−/−) mice. Tissues examined were whole brain minus cerebellum and hypothalamus (Brain), whole hypothalamus (Hypo), and anterior hypothalamus containing SCN (AH/SCN). The specific mPER3 band corresponds in mobility to in vitro-translated mPER3. Results shown are representative of three experiments. (B) Immunoprecipitation. Brain proteins extracted from +/+ or −/− mice were precipitated with antiserum to mCRY1, mCRY2, or mPER3 and separated by SDS-polyacrylamide gel electrophoresis, and the blot was incubated with antiserum to mPER3. The mPER3 band indicated by the arrow corresponds in mobility to in vitro-translated mPER3. Similar results were found in a replicate experiment.
FIG. 3
Northern blot analysis done to identify transcripts arising from the targeted mPer3 allele. Skeletal muscle RNA was hybridized with probes directed to the mPer3 cDNA sequence 5′ or 3′ of the PGK-NEO cassette, to the NEO cassette, and to the portion of mPer3 cDNA deleted by the targeting construct. RNA size standards (in kilobases) are shown on the left.
FIG. 4
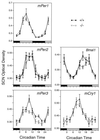
Rhythmic gene expression in the SCN, as assessed by in situ hybridization. Significant rhythms of expression of mPer1, mPer2, mCry1, and Bmal1 were detected in both wild-type and mPER3-deficient mice, and there were no differences between the genotypes. mPer3 RNA levels were significantly reduced in the SCN of _mPer3_-deficient mice. Each value represents the mean ± standard error of the mean for six to eight mice. Adjacent sections from the same group of mice were used for all probes. Tissues were collected on the first day in DD. The horizontal bar at the bottom of each panel represents the lighting cycle that the animals experienced prior to entry into DD: subjective day is gray, and subjective night is black. (Circadian times 0 and 12 represent the times at which the lights would have been turned on and off had the animals remained in LD.) Data from circadian times 3, 21, and 24 are double plotted.
FIG. 5
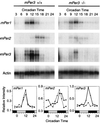
Rhythmic gene expression in skeletal muscle. Autoradiograms from Northern blots illustrate rhythmic expression of mPer1, mPer2, and mPer3 in −/− and +/+ mice on the first day in DD. Hybridization of the actin control probe verified equal loading of the lanes (bottom autoradiogram). Graphs illustrate temporal profiles of mPer gene expression in skeletal muscle. Values are expressed relative to those for actin, and each value represents the mean of two blots. See the legend to Fig. 4 for plotting conventions.
FIG. 6
Representative actograms illustrating rhythmic wheel-running behavior in a wild-type mouse (left) and an mPER3-deficient mouse (right). Each horizontal line represents a 48-h period; the second 24-h period is double plotted, appearing both to the right of and below the first 24-h period. Vertical deflections represent periods of wheel running. Animals were maintained in 12L:12D for the first 8 days of the record and then entered DD. The timing of the lighting cycle is indicated by the horizontal bar at the top. Records shown are from isogenic male mice from study 5 (Table 1).
Similar articles
- Differential functions of mPer1, mPer2, and mPer3 in the SCN circadian clock.
Bae K, Jin X, Maywood ES, Hastings MH, Reppert SM, Weaver DR. Bae K, et al. Neuron. 2001 May;30(2):525-36. doi: 10.1016/s0896-6273(01)00302-6. Neuron. 2001. PMID: 11395012 - Differential regulation of mammalian period genes and circadian rhythmicity by cryptochromes 1 and 2.
Vitaterna MH, Selby CP, Todo T, Niwa H, Thompson C, Fruechte EM, Hitomi K, Thresher RJ, Ishikawa T, Miyazaki J, Takahashi JS, Sancar A. Vitaterna MH, et al. Proc Natl Acad Sci U S A. 1999 Oct 12;96(21):12114-9. doi: 10.1073/pnas.96.21.12114. Proc Natl Acad Sci U S A. 1999. PMID: 10518585 Free PMC article. - Photoperiod differentially regulates clock genes' expression in the suprachiasmatic nucleus of Syrian hamster.
Tournier BB, Menet JS, Dardente H, Poirel VJ, Malan A, Masson-Pévet M, Pévet P, Vuillez P. Tournier BB, et al. Neuroscience. 2003;118(2):317-22. doi: 10.1016/s0306-4522(03)00008-3. Neuroscience. 2003. PMID: 12699768 - [Genetic regulation of circadian rhythms].
Tei H. Tei H. Tanpakushitsu Kakusan Koso. 2004 Feb;49(3 Suppl):456-62. Tanpakushitsu Kakusan Koso. 2004. PMID: 14976772 Review. Japanese. No abstract available. - Synchronization of the molecular clockwork by light- and food-related cues in mammals.
Challet E, Caldelas I, Graff C, Pévet P. Challet E, et al. Biol Chem. 2003 May;384(5):711-9. doi: 10.1515/BC.2003.079. Biol Chem. 2003. PMID: 12817467 Review.
Cited by
- Modeling feedback loops of the Mammalian circadian oscillator.
Becker-Weimann S, Wolf J, Herzel H, Kramer A. Becker-Weimann S, et al. Biophys J. 2004 Nov;87(5):3023-34. doi: 10.1529/biophysj.104.040824. Epub 2004 Sep 3. Biophys J. 2004. PMID: 15347590 Free PMC article. - Expression of the gene for Dec2, a basic helix-loop-helix transcription factor, is regulated by a molecular clock system.
Hamaguchi H, Fujimoto K, Kawamoto T, Noshiro M, Maemura K, Takeda N, Nagai R, Furukawa M, Honma S, Honma K, Kurihara H, Kato Y. Hamaguchi H, et al. Biochem J. 2004 Aug 15;382(Pt 1):43-50. doi: 10.1042/BJ20031760. Biochem J. 2004. PMID: 15147242 Free PMC article. - Anatomical and functional characterization of clock gene expression in neuroendocrine dopaminergic neurons.
Sellix MT, Egli M, Poletini MO, McKee DT, Bosworth MD, Fitch CA, Freeman ME. Sellix MT, et al. Am J Physiol Regul Integr Comp Physiol. 2006 May;290(5):R1309-23. doi: 10.1152/ajpregu.00555.2005. Epub 2005 Dec 22. Am J Physiol Regul Integr Comp Physiol. 2006. PMID: 16373438 Free PMC article. - Thermal stability analyses of human PERIOD-2 C-terminal domain using dynamic light scattering and circular dichroism.
Xian Y, Moreno B, Miranda V, Vijay N, Nunez LC, Choi J, Quinones CS, Rios P, Chauhan N, Moriel KV, Ruelas NJ, Castaneda AE, Rodriguez RC, Amezaga BN, Azzam SZ, Xiao C. Xian Y, et al. PLoS One. 2020 Apr 22;15(4):e0221180. doi: 10.1371/journal.pone.0221180. eCollection 2020. PLoS One. 2020. PMID: 32320392 Free PMC article. - A human sleep homeostasis phenotype in mice expressing a primate-specific PER3 variable-number tandem-repeat coding-region polymorphism.
Hasan S, van der Veen DR, Winsky-Sommerer R, Hogben A, Laing EE, Koentgen F, Dijk DJ, Archer SN. Hasan S, et al. FASEB J. 2014 Jun;28(6):2441-54. doi: 10.1096/fj.13-240135. Epub 2014 Feb 27. FASEB J. 2014. PMID: 24577121 Free PMC article.
References
- Akiyama M, Kouzu Y, Takahashi S, Wakamatsu H, Moriya T, Maetani M, Watanabe S, Tei H, Sakaki Y, Shibata S. Inhibition of light- or glutamate-induced mPer1 expression represses the phase shifts into the mouse circadian locomotor and suprachiasmatic firing rhythms. J Neurosci. 1999;19:1115–1121. - PMC - PubMed
- Albrecht U, Sun Z S, Eichele G, Lee C C. A differential response of two putative mammalian circadian regulators, mper1 and mper2, to light. Cell. 1997;91:1055–1064. - PubMed
- Benezra R, Davis R L, Lockshon D, Turner D L, Weintraub H. The protein Id: a negative regulator of helix-loop-helix DNA binding proteins. Cell. 1990;61:49–59. - PubMed
- Dunlap J C. Molecular bases for circadian clocks. Cell. 1999;96:271–290. - PubMed
- Field M D, Maywood E S, O'Brien J A, Weaver D R, Reppert S M, Hastings M H. Analysis of clock proteins in mouse SCN demonstrates phylogenetic divergence of the circadian clockwork and resetting mechanisms. Neuron. 2000;25:437–447. - PubMed
Publication types
MeSH terms
Substances
Grants and funding
- HD14227/HD/NICHD NIH HHS/United States
- HL07901/HL/NHLBI NIH HHS/United States
- T32 HL007901/HL/NHLBI NIH HHS/United States
- R01 NS039303/NS/NINDS NIH HHS/United States
- NS39303/NS/NINDS NIH HHS/United States
- F32 MH012067/MH/NIMH NIH HHS/United States
LinkOut - more resources
Full Text Sources
Molecular Biology Databases


