Changes in endoplasmic reticulum luminal environment affect cell sensitivity to apoptosis - PubMed (original) (raw)
Changes in endoplasmic reticulum luminal environment affect cell sensitivity to apoptosis
K Nakamura et al. J Cell Biol. 2000.
Abstract
To test the role of ER luminal environment in apoptosis, we generated HeLa cell lines inducible with respect to calreticulin and calnexin and investigated their sensitivity to drug-dependent apoptosis. Overexpression of calreticulin, an ER luminal protein, resulted in an increased sensitivity of the cells to both thapsigargin- and staurosporine-induced apoptosis. This correlated with an increased release of cytochrome c from the mitochondria. Overexpression of calnexin, an integral ER membrane protein, had no significant effect on drug-induced apoptosis. In contrast, calreticulin-deficient cells were significantly resistant to apoptosis and this resistance correlated with a decreased release of cytochrome c from mitochondria and low levels of caspase 3 activity. This work indicates that changes in the lumen of the ER amplify the release of cytochrome c from mitochondria, and increase caspase activity, during drug-induced apoptosis. There may be communication between the ER and mitochondria, which may involve Ca(2+) and play an important role in conferring cell sensitivity to apoptosis. Apoptosis may depend on both the presence of external apoptosis-activating signals, and, as shown in this study, on an internal factor represented by the ER.
Figures
Figure 1
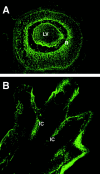
Activation of calreticulin promoter in developing eye and limb buds of transgenic mouse embryos. Transgenic mice expressing GFP under control of the calreticulin promoter were generated as described by Mesaeli et al. 1999. Activation of the calreticulin promoter was monitored by detection of the fluorescent signal obtained from calreticulin promoter-driven expression of the GFP reporter gene (Mesaeli et al. 1999). Mouse embryos (14.5 d old) were dissected out of the uterus and processed for fluorescence analysis using a confocal microscope (Mesaeli et al. 1999). (A) A section of a developing embryonic eye; (B) a section across developing limb bud. High activation of the calreticulin promoter was detected in central retina (R), lens vesicle (LV) and in interdigital cells (IC).
Figure 2
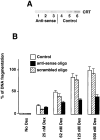
Calreticulin modulates dexamethasone-dependent apoptosis of A1.1 cells. (A) Western blot analysis of calreticulin in A1.1 cells incubated with calreticulin-specific anti-sense oligodeoxynucleotide. Cells were lysed with RIPA buffer, protein separated in SDS-PAGE, transferred to nitrocellulose membrane, and probed with goat anti-calreticulin antibodies. Lanes 1–3, 10, 20, and 30 μg of cell extract from anti-sense oligodeoxynucleotide-treated A1.1 cells, respectively; lanes 4–6, 10, 20, and 30 μg of cell extract from untreated A1.1 cells, respectively. CRT, calreticulin. (B) Downregulation of expression of calreticulin was regulated in A1.1 cells by incubation with specific anti-sense oligodeoxynucleotide followed by DNA fragmentation analysis. Apoptosis was induced with a different concentration of Dex. Open bar, control cells; hatched bar, cells treated with scrambled control oligodeoxynucleotide; full bar, cells treated with anti-sense oligodeoxynucleotide. Data are means ± SD of three independent experiments.
Figure 3
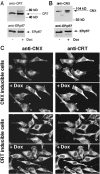
Expression of calreticulin and calnexin in Tet-On–inducible HeLa cell lines. Overexpression of calreticulin (A, KN1 cells) or calnexin (B, KNX2 cells) was induced by incubation of the cells in the presence of 2 μM Dox for 24 h. Cells were harvested, lysed with RIPA buffer. 10 μg of protein was separated in SDS-PAGE transferred to nitrocellulose membrane and probed with anti-calreticulin (A) or anti-calnexin (B) antibodies. Blots were normalized by probing with anti-ERp57 antibodies. Addition of Dox to KN1 or KNX2 cells resulted in 2.3 ± 0.2-fold (mean ± SE; n = 4) and 2.2 ± 0.2-fold (mean ± SE; n = 4) induction in the expression of calreticulin (A) and calnexin (B), respectively, as estimated by densitometry. The positions of molecular markers are indicated. (C) Localization of calreticulin and calnexin in KN1 (calreticulin inducible) and KNX2 (calnexin inducible). (Top) Localization of calreticulin and calnexin in the calnexin Tet-On KNX2 (calnexin inducible). (Bottom) Localization of calreticulin and calnexin in the calreticulin Tet-On KN1 cells (calreticulin inducible). To induce expression of calreticulin and calnexin, KN1 and KNX2 cells were treated with Dox for 24 h, respectively (+Dox). Both calreticulin and calnexin localized predominantly to an ER-like intracellular network. CRT, calreticulin; CNX, calnexin.
Figure 4
Thapsigargin-dependent induction of apoptosis in cells overexpressing calreticulin and calnexin. KN1 and KNX2 cells were incubated with 2 μg Dox/ml (filled bars) for 24 h to induce expression of calreticulin and calnexin, respectively. Cells were treated with thapsigargin followed by Annexin-V binding assay. HeLa-On, mock transfected Tet-On HeLa cells. (Open bars) Cells not incubated with Dox; filled bars, Dox-treated cells. 100% value corresponds to 10,000 cells. Data are means ± SD of three independent experiments. ** P < 0.001.
Figure 5
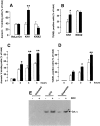
Induction of apoptosis in cells overexpressing calreticulin and calnexin. KN1 and KNX2 cells were incubated with 2 μg Dox/ml (filled bars) for 24 h to induce expression of calreticulin and calnexin, respectively. Cells were treated with staurosporine (A–D) followed by Annexin-V binding assay (A and C) or TUNEL analysis (B and E). In C and D KN1 cells were incubated with staurosporine for the time indicated in the figure followed by Annexin-V binding assay (C) or TUNEL analysis (D). Open bars, cells not incubated with Dox; filled bars, Dox-treated cells. 100% value corresponds to 10,000 cells. Data are means ± SD of three independent experiments. In E, KN1 cells were incubated with 2 μg Dox/ml (+) for 24 h to induce expression of calreticulin. To induce apoptosis control or Dox-treated cells were incubated with 100 nM staurosporine (STS) or 100 μM etoposide. Cytosolic extracts were prepared devoid of mitochondria, separated by SDS-PAGE and immunoblotted with anti-cytochrome c antibodies (Bossy-Wetzel and Green 1999). The position of cytochrome c (Cyt. c) is indicated by the arrow. ** P < 0.001 and * P < 0.005.
Figure 6
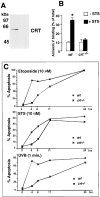
Induction of apoptosis in calreticulin-deficient cells. Wild-type (wt) and calreticulin deficient (crt−/−) mouse fibroblast cell lines were established as described in Materials and Methods. (A) Cells were lysed with RIPA buffer, protein separated in SDS-PAGE, transferred to nitrocellulose membrane and probed with the affinity-purified rabbit anti-calreticulin antibody. The location of calreticulin (CRT) and Bio-Rad Laboratories molecular mass markers are indicated. (B) Wild-type (wt) and calreticulin-deficient (crt−/−) mouse embryonic fibroblasts were treated for 30 min in the absence (open bars) or presence (filled bars) of staurosporine (STS) followed by Annexin-V binding assay as described under Materials and Methods. 100% value corresponds to 10,000 cells. Data are means ± SD of two independent experiments. In C, wild-type (wt) and calreticulin deficient (crt−/−) mouse embryonic fibroblasts were treated with 10 μM etoposide, 10 nM staurosporine (STS), or UV for 1 min. The percentage of apoptosis was determined by light microscopy of eosin and hematoxylin-stained cells as described in Materials and Methods. Statistically significant: * P < 0.001.
Figure 7
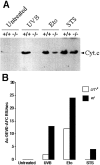
DEVD cleavage activity and cytochrome c release from mitochondria in calreticulin-deficient cells. In A, wild-type (+/+) and calreticulin-deficient (−/−) MEF were treated with UVB for 1 min, 10 μM etoposide, or 10 nM staurosporine (STS). 8 h after the treatment cytosolic extracts were prepared devoid of mitochondria, separated by SDS-PAGE, and immunoblotted with anti-cytochrome c antibodies (Bossy-Wetzel and Green 1999). The position of cytochrome c (Cyt. c) is indicated by the arrow. In B, cytosolic extracts from wild-type (wt) and calreticulin-deficient (crt−/−) MEF treated with UVB for 1 min, 10 μM etoposide, or 10 nM staurosporine (STS) were prepared and tested for DEVD-specific cleavage activity as described in Materials and Methods.
Similar articles
- Necrotic cell death in C. elegans requires the function of calreticulin and regulators of Ca(2+) release from the endoplasmic reticulum.
Xu K, Tavernarakis N, Driscoll M. Xu K, et al. Neuron. 2001 Sep 27;31(6):957-71. doi: 10.1016/s0896-6273(01)00432-9. Neuron. 2001. PMID: 11580896 - Calnexin deficiency and endoplasmic reticulum stress-induced apoptosis.
Zuppini A, Groenendyk J, Cormack LA, Shore G, Opas M, Bleackley RC, Michalak M. Zuppini A, et al. Biochemistry. 2002 Feb 26;41(8):2850-8. doi: 10.1021/bi015967+. Biochemistry. 2002. PMID: 11851433 - Functional relationship between calreticulin, calnexin, and the endoplasmic reticulum luminal domain of calnexin.
Danilczyk UG, Cohen-Doyle MF, Williams DB. Danilczyk UG, et al. J Biol Chem. 2000 Apr 28;275(17):13089-97. doi: 10.1074/jbc.275.17.13089. J Biol Chem. 2000. PMID: 10777614 - Calreticulin: a granule-protein by default or design?
Bleackley RC, Atkinson EA, Burns K, Michalak M. Bleackley RC, et al. Curr Top Microbiol Immunol. 1995;198:145-59. doi: 10.1007/978-3-642-79414-8_9. Curr Top Microbiol Immunol. 1995. PMID: 7774279 Review. No abstract available. - Calreticulin: one protein, one gene, many functions.
Michalak M, Corbett EF, Mesaeli N, Nakamura K, Opas M. Michalak M, et al. Biochem J. 1999 Dec 1;344 Pt 2(Pt 2):281-92. Biochem J. 1999. PMID: 10567207 Free PMC article. Review.
Cited by
- Aberrant Calreticulin Expression in Articular Cartilage of Dio2 Deficient Mice.
Bomer N, Cornelis FM, Ramos YF, den Hollander W, Lakenberg N, van der Breggen R, Storms L, Slagboom PE, Lories RJ, Meulenbelt I. Bomer N, et al. PLoS One. 2016 May 10;11(5):e0154999. doi: 10.1371/journal.pone.0154999. eCollection 2016. PLoS One. 2016. PMID: 27163789 Free PMC article. - The mammalian endoplasmic reticulum as a sensor for cellular stress.
Ma Y, Hendershot LM. Ma Y, et al. Cell Stress Chaperones. 2002 Apr;7(2):222-9. doi: 10.1379/1466-1268(2002)007<0222:tmeraa>2.0.co;2. Cell Stress Chaperones. 2002. PMID: 12380691 Free PMC article. Review. - Intensive stretch-activated CRT-PMCA1 feedback loop promoted apoptosis of myoblasts through Ca2+ overloading.
Ren D, Liu R, Yan X, Zhang Q, Zeng X, Yuan X. Ren D, et al. Apoptosis. 2022 Dec;27(11-12):929-945. doi: 10.1007/s10495-022-01759-4. Epub 2022 Aug 17. Apoptosis. 2022. PMID: 35976579 - Effects of autophage on the proliferation and apoptosis of clear cell renal carcinoma 786-O cells.
Wang Z, Deng Q, Wang Z, Chong T. Wang Z, et al. Int J Clin Exp Pathol. 2019 Apr 1;12(4):1342-1349. eCollection 2019. Int J Clin Exp Pathol. 2019. PMID: 31933948 Free PMC article. - Polysaccharides Extracted from Rhizoma Pleionis Have Antitumor Properties In Vitro and in an H22 Mouse Hepatoma Ascites Model In Vivo.
Fang Y, Ning A, Li S, Zhou S, Liu L, Joseph TP, Zhong M, Jiao J, Zhang W, Shi Y, Zhang M, Huang M. Fang Y, et al. Int J Mol Sci. 2018 May 7;19(5):1386. doi: 10.3390/ijms19051386. Int J Mol Sci. 2018. PMID: 29735884 Free PMC article.
References
- Baffy G., Miyashita T., Williamson J.R., Reed J.C. Apoptosis induced by withdrawal of interleukin-3 (IL-3) from an IL-3-dependent hematopoietic cell line is associated with repartitioning of intracellular calcium and is blocked by enforced Bcl-2 oncoprotein production. J. Biol. Chem. 1993;268:6511–6519. - PubMed
- Barres B.A., Hart I.K., Coles H.S., Burne J.F., Voyvodic J.T., Richardson W.D., Raff M.C. Cell death and control of cell survival in the oligodendrocyte lineage. Cell. 1992;70:31–46. - PubMed
- Bastianutto C., Clementi E., Codazzi F., Podini P., De Giorgi F., Rizzuto R., Meldolesi J., Pozzan T. Overexpression of calreticulin increases the Ca2+ capacity of rapidly exchanging Ca2+ stores and reveals aspects of their luminal microenvironment and function. J. Cell Biol. 1995;130:847–855. - PMC - PubMed
- Bergeron J.J.M., Brenner M.B., Thomas D.Y., Williams D.B. Calnexina membrane-bound chaperone of the endoplasmic reticulum. Trends Biochem. Sci. 1994;19:124–128. - PubMed
- Bertrand R., Solary E., O'Connor P., Kohn K.W., Pommier Y. Induction of a common pathway of apoptosis by staurosporine. Exp. Cell Res. 1994;211:314–321. - PubMed
Publication types
MeSH terms
Substances
LinkOut - more resources
Full Text Sources
Research Materials
Miscellaneous
