Importance of replication in microarray gene expression studies: statistical methods and evidence from repetitive cDNA hybridizations - PubMed (original) (raw)
Importance of replication in microarray gene expression studies: statistical methods and evidence from repetitive cDNA hybridizations
M L Lee et al. Proc Natl Acad Sci U S A. 2000.
Abstract
We present statistical methods for analyzing replicated cDNA microarray expression data and report the results of a controlled experiment. The study was conducted to investigate inherent variability in gene expression data and the extent to which replication in an experiment produces more consistent and reliable findings. We introduce a statistical model to describe the probability that mRNA is contained in the target sample tissue, converted to probe, and ultimately detected on the slide. We also introduce a method to analyze the combined data from all replicates. Of the 288 genes considered in this controlled experiment, 32 would be expected to produce strong hybridization signals because of the known presence of repetitive sequences within them. Results based on individual replicates, however, show that there are 55, 36, and 58 highly expressed genes in replicates 1, 2, and 3, respectively. On the other hand, an analysis by using the combined data from all 3 replicates reveals that only 2 of the 288 genes are incorrectly classified as expressed. Our experiment shows that any single microarray output is subject to substantial variability. By pooling data from replicates, we can provide a more reliable analysis of gene expression data. Therefore, we conclude that designing experiments with replications will greatly reduce misclassification rates. We recommend that at least three replicates be used in designing experiments by using cDNA microarrays, particularly when gene expression data from single specimens are being analyzed.
Figures
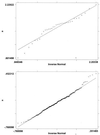
Figure 1
(a), Normal probability plot of main effect estimates for expressed genes. (b), Normal probability plot of main effect estimates for unexpressed. genes.
Figure 2
Overlay of a histogram and mixed normal p.d.f. for gene expression main effect.
Similar articles
- Bayesian models for pooling microarray studies with multiple sources of replications.
Conlon EM, Song JJ, Liu JS. Conlon EM, et al. BMC Bioinformatics. 2006 May 5;7:247. doi: 10.1186/1471-2105-7-247. BMC Bioinformatics. 2006. PMID: 16677390 Free PMC article. - Reproducibility of alternative probe synthesis approaches for gene expression profiling with arrays.
Vernon SD, Unger ER, Rajeevan M, Dimulescu IM, Nisenbaum R, Campbell CE. Vernon SD, et al. J Mol Diagn. 2000 Aug;2(3):124-7. doi: 10.1016/S1525-1578(10)60626-5. J Mol Diagn. 2000. PMID: 11229515 Free PMC article. - Statistical analysis of high-density oligonucleotide arrays: a multiplicative noise model.
Sásik R, Calvo E, Corbeil J. Sásik R, et al. Bioinformatics. 2002 Dec;18(12):1633-40. doi: 10.1093/bioinformatics/18.12.1633. Bioinformatics. 2002. PMID: 12490448 - Fundamentals of experimental design for cDNA microarrays.
Churchill GA. Churchill GA. Nat Genet. 2002 Dec;32 Suppl:490-5. doi: 10.1038/ng1031. Nat Genet. 2002. PMID: 12454643 Review. - [Transcriptomes for serial analysis of gene expression].
Marti J, Piquemal D, Manchon L, Commes T. Marti J, et al. J Soc Biol. 2002;196(4):303-7. J Soc Biol. 2002. PMID: 12645300 Review. French.
Cited by
- Development of a porcine (Sus scofa) embryo-specific microarray: array annotation and validation.
Tsoi S, Zhou C, Grant JR, Pasternak JA, Dobrinsky J, Rigault P, Nieminen J, Sirard MA, Robert C, Foxcroft GR, Dyck MK. Tsoi S, et al. BMC Genomics. 2012 Aug 3;13:370. doi: 10.1186/1471-2164-13-370. BMC Genomics. 2012. PMID: 22863022 Free PMC article. - Global effect of inauhzin on human p53-responsive transcriptome.
Liao JM, Zeng SX, Zhou X, Lu H. Liao JM, et al. PLoS One. 2012;7(12):e52172. doi: 10.1371/journal.pone.0052172. Epub 2012 Dec 21. PLoS One. 2012. PMID: 23284922 Free PMC article. - MicroSAGE is highly representative and reproducible but reveals major differences in gene expression among samples obtained from similar tissues.
Blackshaw S, Kuo WP, Park PJ, Tsujikawa M, Gunnersen JM, Scott HS, Boon WM, Tan SS, Cepko CL. Blackshaw S, et al. Genome Biol. 2003;4(3):R17. doi: 10.1186/gb-2003-4-3-r17. Epub 2003 Feb 18. Genome Biol. 2003. PMID: 12620102 Free PMC article. - How many replicates of arrays are required to detect gene expression changes in microarray experiments? A mixture model approach.
Pan W, Lin J, Le CT. Pan W, et al. Genome Biol. 2002;3(5):research0022. doi: 10.1186/gb-2002-3-5-research0022. Epub 2002 Apr 22. Genome Biol. 2002. PMID: 12049663 Free PMC article. - Gene expression phenotype in heterozygous carriers of ataxia telangiectasia.
Watts JA, Morley M, Burdick JT, Fiori JL, Ewens WJ, Spielman RS, Cheung VG. Watts JA, et al. Am J Hum Genet. 2002 Oct;71(4):791-800. doi: 10.1086/342974. Epub 2002 Sep 11. Am J Hum Genet. 2002. PMID: 12226795 Free PMC article.
References
- Eisen M. scanalyzeUser Manual. Stanford, CA: Stanford Univ.; 1999. , Ver. 2.32.
Publication types
MeSH terms
Substances
Grants and funding
- R01 HL040619/HL/NHLBI NIH HHS/United States
- EY12269-02/EY/NEI NIH HHS/United States
- R01 EY012269/EY/NEI NIH HHS/United States
- HL40619-09/HL/NHLBI NIH HHS/United States
- CA75354/CA/NCI NIH HHS/United States
LinkOut - more resources
Full Text Sources
Other Literature Sources

