The vav exchange factor is an essential regulator in actin-dependent receptor translocation to the lymphocyte-antigen-presenting cell interface - PubMed (original) (raw)
The vav exchange factor is an essential regulator in actin-dependent receptor translocation to the lymphocyte-antigen-presenting cell interface
C Wülfing et al. Proc Natl Acad Sci U S A. 2000.
Abstract
During the interaction of a T cell with an antigen-presenting cell (APC), several receptor ligand pairs, including the T cell receptor (TCR)/major histocompatibility complex (MHC), accumulate at the T cell/APC interface in defined geometrical patterns. This accumulation depends on a movement of the T cell cortical actin cytoskeleton toward the interface. Here we study the involvement of the guanine nucleotide exchange factor vav in this process. We crossed 129 vav(-/-) mice with B10/BR 5C.C7 TCR transgenic mice and used peptide-loaded APCs to stimulate T cells from the offspring. We found that the accumulation of TCR/MHC at the T cell/APC interface and the T cell actin cytoskeleton rearrangement were clearly defective in these vav(+/-) mice. A comparable defect in superantigen-mediated T cell activation of T cells from non-TCR transgenic 129 mice was also observed, although in this case it was more apparent in vav(-/-) mice. These data indicate that vav is an essential regulator of cytoskeletal rearrangements during T cell activation.
Figures
Figure 1
Definition of I-Ek accumulation phenotypes. A three-dimensional reconstruction of the I-Ek-GFP intensity of transfected A20 cells in T cell/APC couples is shown. Increasing I-Ek density is color encoded from blue through green and yellow to red. The color scales have been applied to each of the two cells separately to cover the whole intensity range of the cell. Thus similar colors do not correspond to the same intensity when the two cells are compared. To analyze the amount of accumulation, the difference in absolute intensity values between the interface and the sides and back of the cell is used. The position of the T cell, as identified in a parallel bright field image and visible as a flattening of the APC (in the left-most panels) is on top of the APC for the “concentrated” and at left for the “diffuse” pattern. The four panels are related to each other by a 30° rotation around a horizontal axis for the “concentrated” and a vertical axis for the “diffuse” accumulation pattern.
Figure 2
Vav+/− T cells do not induce a concentrated MHC II accumulation phenotype on interaction with peptide-pulsed APCs. I-Ek-GFP-transfected A20 B cell lymphoma cells were loaded with 10 μM MCC agonist peptide and were used to stimulate either wild-type (WT) or vav+/− T cells. The frequency of occurrence of different geometrical patterns of the I-Ek accumulation at the interface of T cell/APC couples is given. A “concentrated” accumulation pattern is defined in Fig. 1. A “defective” accumulation is either an accumulation that is not sustained during the course of the experiment or that is diffuse as defined in Fig. 1. Wild-type and vav+/− mice nos. 1, 2, and 3 derived from different breedings were analyzed in independent experiments. The number of T cell/APC couples analyzed in each experiment for T cells from wild-type mice nos. 1, 2, and 3 was n = 11, n = 14, n = 13, and for T cell from vav+/− mice nos. 1, 2, 3, it was n = 5, n = 19, and n = 7, respectively.
Figure 3
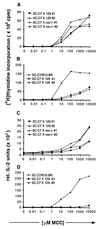
Proliferation and IL-2 secretion dose response to MCC peptide of lymph node cells from 5C.C7 mice crossed with 129 wild-type or 129 vav−/− mice are the same but differ from 5C.C7 mice on its original B10.BR background. Lymph node cells isolated from 5C.C7 mice or the crosses shown in the figures were stimulated for 48 h with B10.BR mouse splenocytes loaded with increasing amounts of MCC peptide. Data are representative of four independent experiments. (A and B) The incorporation of [3H]thymidine during the last 16–20 h of culture was measured. Experiments were performed in triplicates. (C and D) Culture supernatants of the cell cultures described in A and B were assayed in triplicate for IL-2 production by ELISA.
Figure 4
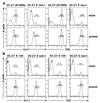
Expression of the 5C.C7 variable domains Vα11 and Vβ3 in 5C.C7 TCR transgenic mice on the B10.BR background or crossed with 129 mice. (A) Reduced 5C.C7 TCR expression in naive lymph node cells of 5C.C7 TCR transgenic mice crossed with 129 vav−/− mice (Upper). After these cells were primed with irradiated B10.BR splenocytes and 3 μM MCC peptide for 5–7 days, only cells positive for both Vα11 and Vβ3 survived (Lower). Naive and primed cells were stained for Vα11 and Vβ3 on different days. Minor differences in staining efficiency may therefore account for the differences in the absolute Vα11 staining intensity between naive and primed cells. (B) Comparable 5C.C7 TCR expression in lymph node cells of 5C.C7 TCR transgenic mice crossed with 129 wild-type or 129 vav−/− mice. Irrespective of the vav genotype, normal levels of the 5C.C7 TCR have been reduced to 6–11% by negative selection, presumably by a superantigen from the 129 background (Upper). After these cells were primed as described in A, only Vα11 and Vβ3-positive cells survived (Lower).
Figure 5
IL-2 secretion dose response to SEE differs significantly between wild-type and vav−/− T cells. Experiments were performed as in Fig. 3 except for the use of 1 μg/ml SEE instead of the MCC peptide. Wild-type mouse splenocytes (129) were used as APCs. Data are representative of six independent experiments.
Figure 6
MHC II accumulation during superantigen-mediated T cell stimulation differs significantly between vav+/+ and vav−/− cells and to a lesser extent between vav+/+ and vav+/− cells. I-Ek-GFP transfected A20 B cell lymphoma cells were loaded with 10 μM SEA or SEE and were used to stimulate either vav+/+, vav+/−, or vav−/− T cells. The I-Ek–GFP accumulation at the T cell/APC interface was analyzed as described in Fig. 2. The number of T cell/APC couples analyzed in each experiment for vav+/+, vav+/−, and vav−/− cells is n = 33, n = 30, and n = 35, respectively. The data are derived from three independent sets of experiments.
Similar articles
- Vav is a regulator of cytoskeletal reorganization mediated by the T-cell receptor.
Fischer KD, Kong YY, Nishina H, Tedford K, Marengère LE, Kozieradzki I, Sasaki T, Starr M, Chan G, Gardener S, Nghiem MP, Bouchard D, Barbacid M, Bernstein A, Penninger JM. Fischer KD, et al. Curr Biol. 1998 May 7;8(10):554-62. doi: 10.1016/s0960-9822(98)70224-6. Curr Biol. 1998. PMID: 9601639 - Age-dependent alterations in the assembly of signal transduction complexes at the site of T cell/APC interaction.
Tamir A, Eisenbraun MD, Garcia GG, Miller RA. Tamir A, et al. J Immunol. 2000 Aug 1;165(3):1243-51. doi: 10.4049/jimmunol.165.3.1243. J Immunol. 2000. PMID: 10903722 - Vav links the T cell antigen receptor to the actin cytoskeleton and T cell activation independently of intrinsic Guanine nucleotide exchange activity.
Miletic AV, Graham DB, Sakata-Sogawa K, Hiroshima M, Hamann MJ, Cemerski S, Kloeppel T, Billadeau DD, Kanagawa O, Tokunaga M, Swat W. Miletic AV, et al. PLoS One. 2009 Aug 12;4(8):e6599. doi: 10.1371/journal.pone.0006599. PLoS One. 2009. PMID: 19672294 Free PMC article. - Vav links antigen-receptor signaling to the actin cytoskeleton.
Fischer KD, Tedford K, Penninger JM. Fischer KD, et al. Semin Immunol. 1998 Aug;10(4):317-27. doi: 10.1006/smim.1998.0124. Semin Immunol. 1998. PMID: 9695188 Review. - Interface accumulation of receptor/ligand couples in lymphocyte activation: methods, mechanisms, and significance.
Wülfing C, Tskvitaria-Fuller I, Burroughs N, Sjaastad MD, Klem J, Schatzle JD. Wülfing C, et al. Immunol Rev. 2002 Nov;189:64-83. doi: 10.1034/j.1600-065x.2002.18907.x. Immunol Rev. 2002. PMID: 12445266 Review.
Cited by
- Mechanism and function of Vav1 localisation in TCR signalling.
Ksionda O, Saveliev A, Köchl R, Rapley J, Faroudi M, Smith-Garvin JE, Wülfing C, Rittinger K, Carter T, Tybulewicz VL. Ksionda O, et al. J Cell Sci. 2012 Nov 15;125(Pt 22):5302-14. doi: 10.1242/jcs.105148. Epub 2012 Sep 6. J Cell Sci. 2012. PMID: 22956543 Free PMC article. - Imaging T-cell antigen recognition and comparing immunological and neuronal synapses.
Donnadieu E, Revy P, Trautmann A. Donnadieu E, et al. Immunology. 2001 Aug;103(4):417-25. doi: 10.1046/j.1365-2567.2001.01268.x. Immunology. 2001. PMID: 11529931 Free PMC article. Review. No abstract available. - Recruitment of activation receptors at inhibitory NK cell immune synapses.
Schleinitz N, March ME, Long EO. Schleinitz N, et al. PLoS One. 2008 Sep 26;3(9):e3278. doi: 10.1371/journal.pone.0003278. PLoS One. 2008. PMID: 18818767 Free PMC article. - Translocation of PKC[theta] in T cells is mediated by a nonconventional, PI3-K- and Vav-dependent pathway, but does not absolutely require phospholipase C.
Villalba M, Bi K, Hu J, Altman Y, Bushway P, Reits E, Neefjes J, Baier G, Abraham RT, Altman A. Villalba M, et al. J Cell Biol. 2002 Apr 15;157(2):253-63. doi: 10.1083/jcb.200201097. Epub 2002 Apr 15. J Cell Biol. 2002. PMID: 11956228 Free PMC article. - Vav1/2/3-null mice define an essential role for Vav family proteins in lymphocyte development and activation but a differential requirement in MAPK signaling in T and B cells.
Fujikawa K, Miletic AV, Alt FW, Faccio R, Brown T, Hoog J, Fredericks J, Nishi S, Mildiner S, Moores SL, Brugge J, Rosen FS, Swat W. Fujikawa K, et al. J Exp Med. 2003 Nov 17;198(10):1595-608. doi: 10.1084/jem.20030874. J Exp Med. 2003. PMID: 14623913 Free PMC article.
References
- Davis M M, Boniface J J, Reich Z, Lyons D, Hampl J, Arden B, Chien Y. Annu Rev Immunol. 1998;16:523–544. - PubMed
- Owen J J, Cooper M D, Raff M C. Nature (London) 1974;249:361–363. - PubMed
- Negulescu P A, Krasieva T B, Khan A, Kerschbaum H H, Cahalan M D. Immunity. 1996;4:421–430. - PubMed
Publication types
MeSH terms
Substances
LinkOut - more resources
Full Text Sources
Other Literature Sources
Molecular Biology Databases
Research Materials
Miscellaneous


