Tracking the response of natural killer T cells to a glycolipid antigen using CD1d tetramers - PubMed (original) (raw)
Tracking the response of natural killer T cells to a glycolipid antigen using CD1d tetramers
J L Matsuda et al. J Exp Med. 2000.
Abstract
A major group of natural killer (NK) T cells express an invariant Valpha14(+) T cell receptor (TCR) specific for the lipoglycan alpha-galactosylceramide (alpha-GalCer), which is presented by CD1d. These cells may have an important immune regulatory function, but an understanding of their biology has been hampered by the lack of suitable reagents for tracking them in vivo. Here we show that tetramers of mouse CD1d loaded with alpha-GalCer are a sensitive and highly specific reagent for identifying Valpha14(+) NK T cells. Using these tetramers, we find that alpha-GalCer-specific T lymphocytes are more widely distributed than was previously appreciated, with populations of largely NK1.1(-) but tetramer-binding T cells present in the lymph nodes and the intestine. Injection of alpha-GalCer leads to the production of both interferon gamma and interleukin 4 by nearly all NK T cells in the liver and the majority of the spleen within 2 h. These cells mostly disappear by 5 h, and they do not reappear after 1 wk. Curiously, tetramer-positive thymocytes do not rapidly synthesize cytokines, nor do they undergo decreases in cell number after lipid antigen stimulation, although they express equivalent TCR levels. In summary, the data presented here demonstrate that alpha-GalCer-specific NK T cells undergo a unique and highly compartmentalized response to antigenic stimulation.
Figures
Figure 1
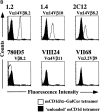
Specific CD1d multimer staining of T cell hybridomas. (A) Comparison of mCD1d and hCD1d dimer staining of the 1.2 and 1.4 NK T cell hybridomas. (B) Comparison of mCD1d tetramer staining of the indicated T cell hybridomas using α-GalCer–loaded and unloaded tetramers. One representative experiment of three is shown.
Figure 2
Inhibition of tetramer binding by recombinant CD1d molecules. 1.2 hybridoma cells were incubated with the indicated concentrations of competitor molecules before addition of tetramerized mCD1d. The data are represented as percent of tetramer staining in the absence of a competitor. As a control, even the highest concentration of competing multimerized CD1d molecules did not affect the T cell hybridoma staining with the anti-TCR Cβ antibody H57-597 (data not shown). This experiment was repeated three times with similar results.
Figure 3
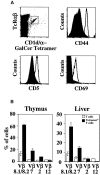
Tetramer-positive cells have the expected phenotypic markers of NK T cells. (A) Phenotypic analysis of tetramer-positive cells in the thymus. Histogram overlays of tetramer-positive TCR-βint cells (open histogram) and control stainings (shaded histogram) reveal the tetramer-positive population to be CD5+CD44highCD69+. Conventional T cells served as the control staining for CD44, and for CD5 and CD69, background staining was used due to the presence of conventional T cells staining positive for these markers. (B) Tetramer-positive T cells show a bias in Vβ gene segment usage as compared with conventional T cells. Conventional T cell controls are the lymphocytes expressing high levels of TCR-β in the thymus (upper left gate in A) and TCR-βhigh and NK1.1− T cells in the liver. Each of these figures is derived from two experiments with similar results.
Figure 4
Tetramer binding is dependent upon CD1d and Jα281 expression. (A) Representative analysis for expression of TCR-β and either tetramer (top row) or NK1.1 (bottom row) of liver mononuclear cells from the indicated strains of mice. The numbers indicate the percentage of the liver mononuclear cell preparation that is positive. (B) Comparison of the percentages of tetramer-positive T cells and NK1.1+ T cells in the thymus, liver, and spleen for the different strains of mice. The average values for the indicated number of mice of each strain are shown.
Figure 6
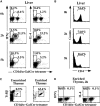
Kinetics and tissue specificity of in vivo response of NK T cells to α-GalCer. (A) Time course of the response in the liver to intravenous injection of α-GalCer. Intracellular cytokine staining was carried out as described in Materials and Methods. (B) CD4+, tetramer-positive cells in the liver are rapidly and selectively diminished after α-GalCer injection. The percentage of CD4+ cells among the gated tetramer-positive cells at various time points is shown. (C) Enrichment of tetramer-positive cells in the thymus using magnetic beads. (D) Thymocytes fail to produce IL-4 or IFN-γ 2 h after α-GalCer injection. Three mice were analyzed showing similar results for each time point depicted. Percentages for individual mice are shown in the figure, with averages of several mice in the text.
Figure 7
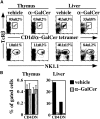
C57Bl/6 mice primed with α-GalCer fail to recover tetramer-positive T cell numbers in the liver 1 wk after priming. (A) Representative flow cytometry analysis of tetramer-positive T cells and NK1.1+ T cells in thymi and livers of vehicle- or α-GalCer–primed mice. (B) CD4/CD8 phenotype analysis of tetramer-positive T cells found in the livers and thymi of vehicle- or α-GalCer–primed mice. Three mice were analyzed, each for the vehicle and α-GalCer.
Figure 5
Frequency and phenotype of tetramer-binding cells from various organs of C57Bl/6 mice. (A) Tetramer staining and the CD4/CD8 phenotype of the tetramer-positive cells. Depicted are representative data of cells from the thymus, liver, bone marrow (BM), spleen, peripheral lymph nodes (LN), and IELs. The percentages indicate the proportion of tetramer-positive T cells in the lymphocyte gate. For each organ, the gated tetramer-positive cells were analyzed for their CD4 and CD8 phenotype. (B) Analysis of NK1.1 expression by cells from different organs gated for tetramer binding. (C) Analysis of tetramer reactivity of cells from different organs gated for NK1.1 expression. Percentages and standard deviations were determined based on the analysis of six mice for the liver, spleen, and thymus and for two mice in the lymph node, bone marrow, and IELs.
Comment in
- CD1d-glycolipid tetramers: A new tool to monitor natural killer T cells in health and disease.
MacDonald HR. MacDonald HR. J Exp Med. 2000 Sep 4;192(5):F15-20. doi: 10.1084/jem.192.5.f15. J Exp Med. 2000. PMID: 10974042 Free PMC article. No abstract available.
Similar articles
- Human invariant V alpha 24-J alpha Q TCR supports the development of CD1d-dependent NK1.1+ and NK1.1- T cells in transgenic mice.
Capone M, Cantarella D, Schümann J, Naidenko OV, Garavaglia C, Beermann F, Kronenberg M, Dellabona P, MacDonald HR, Casorati G. Capone M, et al. J Immunol. 2003 Mar 1;170(5):2390-8. doi: 10.4049/jimmunol.170.5.2390. J Immunol. 2003. PMID: 12594262 - A subset of NKT cells that lacks the NK1.1 marker, expresses CD1d molecules, and autopresents the alpha-galactosylceramide antigen.
Hameg A, Apostolou I, Leite-De-Moraes M, Gombert JM, Garcia C, Koezuka Y, Bach JF, Herbelin A. Hameg A, et al. J Immunol. 2000 Nov 1;165(9):4917-26. doi: 10.4049/jimmunol.165.9.4917. J Immunol. 2000. PMID: 11046017 - The complementarity determining region 2 of BV8S2 (V beta 8.2) contributes to antigen recognition by rat invariant NKT cell TCR.
Pyz E, Naidenko O, Miyake S, Yamamura T, Berberich I, Cardell S, Kronenberg M, Herrmann T. Pyz E, et al. J Immunol. 2006 Jun 15;176(12):7447-55. doi: 10.4049/jimmunol.176.12.7447. J Immunol. 2006. PMID: 16751390 - Regulation of immune responses by CD1d-restricted natural killer T cells.
Van Kaer L. Van Kaer L. Immunol Res. 2004;30(2):139-53. doi: 10.1385/IR:30:2:139. Immunol Res. 2004. PMID: 15477656 Review. - Antigen specificity of semi-invariant CD1d-restricted T cell receptors: the best of both worlds?
Gumperz JE. Gumperz JE. Immunol Cell Biol. 2004 Jun;82(3):285-94. doi: 10.1111/j.0818-9641.2004.01257.x. Immunol Cell Biol. 2004. PMID: 15186260 Review.
Cited by
- Lipid accumulation in adipose tissue-resident iNKT cells contributes to an inflammatory phenotype.
Morris I, Vrieling F, Bouwman A, Stienstra R, Kalkhoven E. Morris I, et al. Adipocyte. 2024 Dec;13(1):2421750. doi: 10.1080/21623945.2024.2421750. Epub 2024 Nov 1. Adipocyte. 2024. PMID: 39484712 Free PMC article. - Thymic development of human natural killer T cells: recent advances and implications for immunotherapy.
Pellicci DG, Tavakolinia N, Perriman L, Berzins SP, Menne C. Pellicci DG, et al. Front Immunol. 2024 Aug 29;15:1441634. doi: 10.3389/fimmu.2024.1441634. eCollection 2024. Front Immunol. 2024. PMID: 39267746 Free PMC article. Review. - Traversing the bench to bedside journey for iNKT cell therapies.
O'Neal J, Mavers M, Jayasinghe RG, DiPersio JF. O'Neal J, et al. Front Immunol. 2024 Aug 7;15:1436968. doi: 10.3389/fimmu.2024.1436968. eCollection 2024. Front Immunol. 2024. PMID: 39170618 Free PMC article. Review. - Lipidomic scanning of self-lipids identifies headless antigens for natural killer T cells.
Cheng TY, Praveena T, Govindarajan S, Almeida CF, Pellicci DG, Arkins WC, Van Rhijn I, Venken K, Elewaut D, Godfrey DI, Rossjohn J, Moody DB. Cheng TY, et al. Proc Natl Acad Sci U S A. 2024 Aug 20;121(34):e2321686121. doi: 10.1073/pnas.2321686121. Epub 2024 Aug 14. Proc Natl Acad Sci U S A. 2024. PMID: 39141352 Free PMC article. - invariant Natural Killer T cell therapy as a novel therapeutic approach in hematological malignancies.
Boonchalermvichian C, Yan H, Gupta B, Rubin A, Baker J, Negrin RS. Boonchalermvichian C, et al. Front Transplant. 2024 May 6;3:1353803. doi: 10.3389/frtra.2024.1353803. eCollection 2024. Front Transplant. 2024. PMID: 38993780 Free PMC article. Review.
References
- Bendelac A., Rivera M.N., Park S.H., Roark J.H. Mouse CD1-specific NK1 T cellsdevelopment, specificity, and function. Annu. Rev. Immunol. 1997;15:535–562. - PubMed
- Gombert J.M., Herbelin A., Tancrede-Bohin E., Dy M., Carnaud C., Bach J.-F. Early quantitative and functional deficiency of NK1+-like thymocytes in the NOD mouse. Eur. J. Immunol. 1996;26:2989–2998. - PubMed
- Hammond K.J.L., Poulton L.D., Palmisano L.J., Silveira P.A., Godfrey D.I., Baxter A.G. α/β-T cell receptor (TCR)+CD4−CD8− (NKT) thymocytes prevent insulin-dependent diabetes mellitus in nonobese diabetic (NOD)/Lt mice by the influence of interleukin (IL)-4 and/or IL-10. J. Exp. Med. 1998;187:1047–1056. - PMC - PubMed
Publication types
MeSH terms
Substances
Grants and funding
- R01 AI043407/AI/NIAID NIH HHS/United States
- R01 AI043407-04/AI/NIAID NIH HHS/United States
- R01 CA052511/CA/NCI NIH HHS/United States
- R01 CA52511/CA/NCI NIH HHS/United States
LinkOut - more resources
Full Text Sources
Other Literature Sources


