The gamma-aminobutyric acid type A (GABAA) receptor-associated protein (GABARAP) promotes GABAA receptor clustering and modulates the channel kinetics - PubMed (original) (raw)
The gamma-aminobutyric acid type A (GABAA) receptor-associated protein (GABARAP) promotes GABAA receptor clustering and modulates the channel kinetics
L Chen et al. Proc Natl Acad Sci U S A. 2000.
Abstract
A microtubule-associated protein, gamma-aminobutyric acid type A (GABA(A)) receptor-associated protein (GABARAP), was previously identified as binding to the intracellular domain of GABA(A) receptors by using the yeast two-hybrid screen. In the present work, immunofluorescent staining and green fluorescent protein-tagged receptor subunits showed that GABARAP is associated with and promotes the clustering of GABA(A) receptors in QT-6 quail fibroblasts. The tubulin-binding motif of GABARAP and the gamma2 subunit of the receptor are required. Disruption of microtubules prevents the clustering in a time-dependent manner. When green fluorescent protein-tagged alpha1 or gamma2 subunit coexpressed with beta2, gamma2L, and GABARAP was used, recordings from visually identified cells revealed that clustered GABA(A) receptor had an EC(50) of about 20 microM, vs. 5.7 microM for the diffuse receptor. Clustered receptors deactivated faster and desensitized slower than the diffuse receptors, because of decrease in the apparent affinity of GABA binding. Different properties for clustered receptors relative to unclustered receptors in heterologous cells suggest that homologous differences between extrasynaptic and synaptic clustered receptors in neurons may be due to the organization of the postsynaptic machinery.
Figures
Figure 1
GABARAP cluster GABAA receptors. This figure shows immunofluorescence of GABAA receptor expressed in QT-6 cells with or without GABARAP. All of the cells shown here expressed α1β2γ2L GABAA receptor and stained with antibody bd17. (A) Large flat cell expressing GABARAP gives clustered GABA receptors. (B) Spherical cell with GABARAP gives clusters; note “broken” periphery. (C) Large flat cell with antisense GABARAP shows diffuse GABAA receptors. (D and E) Confocal images of antibody-labeled GABAA receptors (D, green) and GABARAP (E, red) at the cell surface. (F) A merge of D and_E_, showing colocalization in yellow.
Figure 2
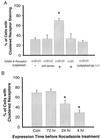
The γ2 subunit, tubulin-binding motif of GABARAP, and microtubules are involved in clustering of GABAA receptors. (A) GABARAP promotes GABAA receptor clustering when coexpressed in QT-6 cells. The bar graph summarizes the percentage of cells that had GABAA receptor clusters. The expressed subunits and GABARAP are shown below. The bd17-positive QT-6 cells were randomly divided into about 100 cells per group, then the percentage of cells with clustered staining in each group was counted [(number of cells showing clustered stain/total of cells in the group) × 100%]. Each bar represents the mean and SD of 6–10 groups of the cells. *, P < 0.001 (t test). (B) Microtubule disruption prevents clustering of GABAA receptors in a time-dependent manner. QT-6 cells were transfected with plasmids encoding α1, β2, γ2L-GFP GABAA receptors and GABARAP. The microtubule disruption agent nocodazole (1 μg/ml) was added into culture medium at 4 h, 24 h, and 72 h after transfection. GFP-tagged receptors were examined with clustering assay described above. Each bar represents the mean and SD of 4–6 groups of the cells. *,P < 0.001 (t test).
Figure 3
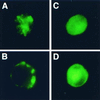
GFP-tagged GABAA receptor subunits visualize the receptors in live QT-6 cells. The cells shown in A and_B_ were transfected with plasmids encoding α1-GFP, β2, γ2L, and GABARAP. After 72 h of expression, the cells were dissociated and replated into a recording chamber and the picture was taken with a Nikon inverted fluorescence microscope. A shows the clustered receptors on the top of the cell. B shows broken perimeter indicative of clusters. C and_D_ were taken from cells expressing α1-GFP, β2, γ2L and without exogenous GABARAP. These pictures show diffuse receptors.
Figure 4
Clustering of GABAA receptors decreases apparent affinity for GABA. (A) Whole-cell patch clamping recordings of GABA-induced currents from diffuse GABAA receptors. The line above the traces indicates the time period of GABA application. The holding potential was −60 mV. The GABA responses saturated at 50–100 μM. (B) Whole-cell currents from a cell with clustered GABAA receptors. The holding potential was −60 mV. The peak currents saturated at 400-1000 μM GABA. (C) Dose–response curves for diffuse GABAA receptor. The data were fit with a four-parameter logistic equation:I = _I_max/{1 + 10(log EC50 − log[GABA])H)}, where_I_max is the maximum current induced by saturating dose of GABA, the Hill coefficient H is 1.0, and [GABA] is the concentration of GABA. From seven cells, the average EC50 is 5.7 ± 1.4 μM (mean ± SE). (D) Dose–response relationship of clustered GABAA receptors. The data were fit with the same equation as in C. From seven cells, the average EC50 is 20.3 ± 3.8 μM (mean ± SE). The large difference in apparent affinity between clustered and diffuse receptors is statistically significant (P < 0.001,t test).
Figure 5
Clustering increases deactivation rate. The cell was held at −60 mV, and the dashed line indicates zero current level. GABA (5 μM) induced an inward current. When GABA was rapidly removed, the current gradually decreased to zero. The deactivation phase of currents was best fit with a single exponential. Diffuse receptors had an average time constant τ = 117 ± 10.5 ms (mean ± SE, n = 6); clustered receptors' deactivation rate was faster, with time constant shorter, τ = 51 ± 4 ms (mean ± SE,n = 3). The difference is statistically significant (P < 0.05, t test).
Figure 6
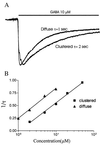
Clustering changes desensitization. (A) Two traces of 10 μM GABA-induced currents were normalized. The line above the traces indicates the time period of GABA application. The holding potential was −60 mV. The decay of the currents was fitted with a single exponential. Diffuse receptors desensitized at a time constant τ = 1 s; clustered receptors had a τ = 2 s. (B) The concentration-dependent rate constant of desensitization. The data points represent the average value from 5 cells with diffuse receptors and 7 cells with clustered receptors. The data were fitted with an equation: 1/τ = α log[GABA] +C, where τ is the time constant for desensitization, [GABA] is the concentration of GABA, α is the rate constant of desensitization, C is the desensitization rate (1/τ) at [GABA] = 1 μM. Both diffuse and clustered receptors had almost same α value (0.57 vs. 0.59 M−1⋅s−1) but different C (0.25 vs. 0 μM). This result means that clustering may change not the concentration-dependent rate constant of desensitization, but the apparent affinity of GABA binding.
Comment in
- Sticking together.
Kennedy MB. Kennedy MB. Proc Natl Acad Sci U S A. 2000 Oct 10;97(21):11135-6. doi: 10.1073/pnas.97.21.11135. Proc Natl Acad Sci U S A. 2000. PMID: 11027319 Free PMC article. No abstract available.
Similar articles
- Subunit specificity and interaction domain between GABA(A) receptor-associated protein (GABARAP) and GABA(A) receptors.
Nymann-Andersen J, Wang H, Chen L, Kittler JT, Moss SJ, Olsen RW. Nymann-Andersen J, et al. J Neurochem. 2002 Mar;80(5):815-23. doi: 10.1046/j.0022-3042.2002.00762.x. J Neurochem. 2002. PMID: 11948245 - Tandem subunits effectively constrain GABAA receptor stoichiometry and recapitulate receptor kinetics but are insensitive to GABAA receptor-associated protein.
Boileau AJ, Pearce RA, Czajkowski C. Boileau AJ, et al. J Neurosci. 2005 Dec 7;25(49):11219-30. doi: 10.1523/JNEUROSCI.3751-05.2005. J Neurosci. 2005. PMID: 16339017 Free PMC article. - GABA(A)-receptor-associated protein links GABA(A) receptors and the cytoskeleton.
Wang H, Bedford FK, Brandon NJ, Moss SJ, Olsen RW. Wang H, et al. Nature. 1999 Jan 7;397(6714):69-72. doi: 10.1038/16264. Nature. 1999. PMID: 9892355 - GABARAP: lessons for synaptogenesis.
Coyle JE, Nikolov DB. Coyle JE, et al. Neuroscientist. 2003 Jun;9(3):205-16. doi: 10.1177/1073858403009003013. Neuroscientist. 2003. PMID: 15065816 Review. - GABARAP and GABA(A) receptor clustering.
Phillips WD, Froehner SC. Phillips WD, et al. Neuron. 2002 Jan 3;33(1):4-6. doi: 10.1016/s0896-6273(01)00569-4. Neuron. 2002. PMID: 11779472 Review.
Cited by
- Sequence-specific 1H, 13C and 15N resonance assignments of human GABA receptor associated protein.
Stangler T, Mayr LM, Dingley AJ, Luge C, Willbold D. Stangler T, et al. J Biomol NMR. 2001 Oct;21(2):183-4. doi: 10.1023/a:1012416810974. J Biomol NMR. 2001. PMID: 11727985 No abstract available. - Molecular and Regulatory Mechanisms of Desensitization and Resensitization of GABAA Receptors with a Special Reference to Propofol/Barbiturate.
Kang Y, Saito M, Toyoda H. Kang Y, et al. Int J Mol Sci. 2020 Jan 15;21(2):563. doi: 10.3390/ijms21020563. Int J Mol Sci. 2020. PMID: 31952324 Free PMC article. Review. - A new perspective on the autophagic and non-autophagic functions of the GABARAP protein family: a potential therapeutic target for human diseases.
Chen J, Zhao H, Liu M, Chen L. Chen J, et al. Mol Cell Biochem. 2024 Jun;479(6):1415-1441. doi: 10.1007/s11010-023-04800-5. Epub 2023 Jul 13. Mol Cell Biochem. 2024. PMID: 37440122 Review. - Electrophysiology of ionotropic GABA receptors.
Sallard E, Letourneur D, Legendre P. Sallard E, et al. Cell Mol Life Sci. 2021 Jul;78(13):5341-5370. doi: 10.1007/s00018-021-03846-2. Epub 2021 Jun 1. Cell Mol Life Sci. 2021. PMID: 34061215 Free PMC article. Review. - Sustained structural change of GABA(A) receptor-associated protein underlies long-term potentiation at inhibitory synapses on a cerebellar Purkinje neuron.
Kawaguchi SY, Hirano T. Kawaguchi SY, et al. J Neurosci. 2007 Jun 20;27(25):6788-99. doi: 10.1523/JNEUROSCI.1981-07.2007. J Neurosci. 2007. PMID: 17581966 Free PMC article.
References
- Whatley V J, Harris R A. Int Rev Neurobiol. 1996;39:113–143. - PubMed
- Whatley V J, Mihic S J, Allan A M, McQuilkin S J, Harris R A. J Biol Chem. 1994;269:19546–19552. - PubMed
- Crestani F, Lorez M, Baer K, Essrich C, Benke D, Laurent J P, Belzung C, Fritschy J M, Luscher B, Mohler H. Nat Neurosci. 1999;2:833–839. - PubMed
- Sassoe-Pognetto M, Kirsch J, Grunert U, Greferath U, Fritschy J M, Mohler H, Betz H. J Comp Neurol. 1995;357:1–14. - PubMed
Publication types
MeSH terms
Substances
Grants and funding
- R01 NS028772/NS/NINDS NIH HHS/United States
- P01 NS035985/NS/NINDS NIH HHS/United States
- HD06576/HD/NICHD NIH HHS/United States
- P01 HD006576/HD/NICHD NIH HHS/United States
- NS35985/NS/NINDS NIH HHS/United States
- NS28772/NS/NINDS NIH HHS/United States
LinkOut - more resources
Full Text Sources
Molecular Biology Databases


