Retrovirus-mediated gene transfer of MLL-ELL transforms primary myeloid progenitors and causes acute myeloid leukemias in mice - PubMed (original) (raw)
Retrovirus-mediated gene transfer of MLL-ELL transforms primary myeloid progenitors and causes acute myeloid leukemias in mice
C Lavau et al. Proc Natl Acad Sci U S A. 2000.
Abstract
The MLL-ELL fusion gene results from the translocation t(11;19)(q23;p13.1) that is associated with de novo and therapy-related acute myeloid leukemia. To study its transforming properties, we retrovirally transduced primary murine hematopoietic progenitors and assessed their growth properties both in vitro and in vivo. MLL-ELL increased the proliferation of myeloid colony-forming cells in methylcellulose cultures upon serial replating, whereas overexpression of ELL alone had no effect. We reconstituted lethally irradiated congenic mice with bone marrow progenitors transduced with MLL-ELL or the control MIE vector encoding the enhanced green fluorescent protein. When the peripheral blood of the mice was analyzed 11-13 weeks postreconstitution, we found that the engraftment of the MLL-ELL-transduced cells was superior to that of the MIE controls. At this time point, the contribution of the donor cells was normally distributed among the myeloid and nonmyeloid compartments. Although all of the MIE animals (n = 10) remained healthy for more than a year, all of the MLL-ELL mice (n = 20) succumbed to monoclonal or pauciclonal acute myeloid leukemias within 100-200 days. The leukemic cells were readily transplantable to secondary recipients and could be established as immortalized cell lines in liquid cultures. These studies demonstrate the enhancing effect of MLL-ELL on the proliferative potential of myeloid progenitors as well as its causal role in the genesis of acute myeloid leukemias.
Figures
Figure 1
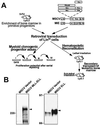
Schematic representation of the experimental strategy and expression of the constructs. (A) Scheme used to compare the proliferative effect of MLL-ELL to_MLL-ENL_ and to mutants in vitro and to study its leukemic effect in vivo. IRES, internal ribosomal entry site; PGK, phosphoglycerate kinase. (B) Western blot analysis of MLL-ELL and ELL expressed from the MSCV construct in transfected Bosc23 cells by using an anti-ELL antiserum. The arrowheads indicate the specific bands. The MLL-ELL fusion protein migrates at approximately 250 kDa and the ELL protein migrates at approximately 75 kDa. The position of molecular mass markers is shown.
Figure 2
Proliferative effect of MLL-ELL compared with that of_MLLdel_, ELL, and MLL-ENL. The bars represent the number of colonies per 104 input cells generated after secondary, tertiary, and quaternary rounds of plating in methylcellulose. Results shown represent the mean ± SD from at least four independent experiments.
Figure 3
Survival curves of mice reconstituted with stem cells transduced by MSCV-MLL-ELL, MIEMLL-ELL, or MIE.
Figure 4
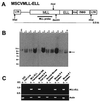
Proviral structure, integration, and expression in MSCVMLL-ELL mice. (A) Structure of the MSCVMLL-ELL retrovirus. Indicated are the diagnostic _Nhe_I, Bam_HI, and_Nco_I restriction endonuclease recognition sites that permit assessment of provirus integrity and copy number. PGK, phosphoglycerate kinase. (B) Southern blot analysis of_Nhe_I-digested genomic DNA with an MLL probe showing that leukemic spleens from MSCVMLL-ELL mice harbor nonrearranged (8.8-kb_Nhe_I band indicated by arrow) proviruses. The 10-kb fragment is representative of the endogenous_MLL gene. At left is sizes (in kb) of the molecular weight standards. (C) Expression by reverse transcription–PCR of retroviral-derived MLL-ELL. Expression was studied in a negative control cell line (32D),_MLL-ELL_-transduced BM, a cell line derived from the leukemic BM of mouse #4 as well as in spleen from leukemic mice (spleen from mice #1 and #4 are shown), or from a control normal mouse.
Figure 5
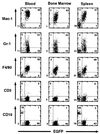
Immunophenotyping of _MLL-ELL_-associated leukemias by flow cytometry. Analysis of EGFP expression versus expression of lineage-specific markers (Mac-1 and F4/80 for macrophages, Gr-1 for granulocytes, CD3 for T cells, or CD19 for B cells) from the PB, BM or spleen of a representative MIEMLL-ELL mouse. The numbers indicate the percentage of cells that are present in each quadrant.
Figure 6
Morphology of MLL-ELL leukemic cells. Wright-Giemsa stain of (A) PB smear showing marked leukocytosis consisting predominantly of mature and immature myeloid cells and (B) BM cytospin revealing preponderance of myeloblasts (mouse #1). (Bar = 133 μm.)
Similar articles
- A carboxy-terminal domain of ELL is required and sufficient for immortalization of myeloid progenitors by MLL-ELL.
DiMartino JF, Miller T, Ayton PM, Landewe T, Hess JL, Cleary ML, Shilatifard A. DiMartino JF, et al. Blood. 2000 Dec 1;96(12):3887-93. Blood. 2000. PMID: 11090074 - The elongation domain of ELL is dispensable but its ELL-associated factor 1 interaction domain is essential for MLL-ELL-induced leukemogenesis.
Luo RT, Lavau C, Du C, Simone F, Polak PE, Kawamata S, Thirman MJ. Luo RT, et al. Mol Cell Biol. 2001 Aug;21(16):5678-87. doi: 10.1128/MCB.21.16.5678-5687.2001. Mol Cell Biol. 2001. PMID: 11463848 Free PMC article. - Molecular analysis of t(11;19) breakpoints in childhood acute leukemias.
Rubnitz JE, Behm FG, Curcio-Brint AM, Pinheiro RP, Carroll AJ, Raimondi SC, Shurtleff SA, Downing JR. Rubnitz JE, et al. Blood. 1996 Jun 1;87(11):4804-8. Blood. 1996. PMID: 8639852 - The role of the MLL gene in infant leukemia.
Eguchi M, Eguchi-Ishimae M, Greaves M. Eguchi M, et al. Int J Hematol. 2003 Dec;78(5):390-401. doi: 10.1007/BF02983811. Int J Hematol. 2003. PMID: 14704031 Review. - Learning from mouse models of MLL fusion gene-driven acute leukemia.
Schwaller J. Schwaller J. Biochim Biophys Acta Gene Regul Mech. 2020 Aug;1863(8):194550. doi: 10.1016/j.bbagrm.2020.194550. Epub 2020 Apr 19. Biochim Biophys Acta Gene Regul Mech. 2020. PMID: 32320749 Review.
Cited by
- miR-550-1 functions as a tumor suppressor in acute myeloid leukemia via the hippo signaling pathway.
Hu C, Yu M, Li C, Wang Y, Li X, Ulrich B, Su R, Dong L, Weng H, Huang H, Jiang X, Chen J, Jin J. Hu C, et al. Int J Biol Sci. 2020 Sep 1;16(15):2853-2867. doi: 10.7150/ijbs.44365. eCollection 2020. Int J Biol Sci. 2020. PMID: 33061801 Free PMC article. - Acquisition of mixed lineage leukemia rearrangement in a chronic myeloid leukemia patient while on imatinib.
Zámečníkova A. Zámečníkova A. Hematol Rep. 2011 Aug 31;3(2):e13. doi: 10.4081/hr.2011.e13. Hematol Rep. 2011. PMID: 22184534 Free PMC article. No abstract available. - The human formin-binding protein 17 (FBP17) interacts with sorting nexin, SNX2, and is an MLL-fusion partner in acute myelogeneous leukemia.
Fuchs U, Rehkamp G, Haas OA, Slany R, Kōnig M, Bojesen S, Bohle RM, Damm-Welk C, Ludwig WD, Harbott J, Borkhardt A. Fuchs U, et al. Proc Natl Acad Sci U S A. 2001 Jul 17;98(15):8756-61. doi: 10.1073/pnas.121433898. Epub 2001 Jul 3. Proc Natl Acad Sci U S A. 2001. PMID: 11438682 Free PMC article. - ELL and EAF1 are Cajal body components that are disrupted in MLL-ELL leukemia.
Polak PE, Simone F, Kaberlein JJ, Luo RT, Thirman MJ. Polak PE, et al. Mol Biol Cell. 2003 Apr;14(4):1517-28. doi: 10.1091/mbc.e02-07-0394. Mol Biol Cell. 2003. PMID: 12686606 Free PMC article. - Functional analysis of the leukemia protein ELL: evidence for a role in the regulation of cell growth and survival.
Johnstone RW, Gerber M, Landewe T, Tollefson A, Wold WS, Shilatifard A. Johnstone RW, et al. Mol Cell Biol. 2001 Mar;21(5):1672-81. doi: 10.1128/MCB.21.5.1672-1681.2001. Mol Cell Biol. 2001. PMID: 11238904 Free PMC article.
References
- Thirman M J, Gill H J, Burnett R C, Mbangkollo D, McCabe N R, Kobayashi H, Ziemin-van der Poel S, Kaneko Y, Morgan R, Sandberg A A, et al. N Engl J Med. 1993;329:909–914. - PubMed
- Thirman M J, Larson R A. Hematol Oncol Clin North Am. 1996;10:293–320. - PubMed
- Gu Y, Nakamura T, Alder H, Prasad R, Canaani O, Cimino G, Croce C M, Canaani E. Cell. 1992;71:701–708. - PubMed
- Tkachuk D C, Kohler S, Cleary M L. Cell. 1992;71:691–700. - PubMed
Publication types
MeSH terms
Substances
LinkOut - more resources
Full Text Sources
Other Literature Sources
Medical
Molecular Biology Databases


