Indomethacin-induced apoptosis in esophageal adenocarcinoma cells involves upregulation of Bax and translocation of mitochondrial cytochrome C independent of COX-2 expression - PubMed (original) (raw)
Indomethacin-induced apoptosis in esophageal adenocarcinoma cells involves upregulation of Bax and translocation of mitochondrial cytochrome C independent of COX-2 expression
S Aggarwal et al. Neoplasia. 2000 Jul-Aug.
Abstract
The prolonged use of nonsteroidal anti-inflammatory drugs (NSAIDs) has been shown to exert a chemopreventive effect in esophageal and other gastrointestinal tumors. The precise mechanism by which this occurs, however, is unknown. While the inhibition of COX-2 as a potential explanation for this chemopreventive effect has gained a great deal of support, there also exists evidence supporting the presence of cyclooxygenase-independent pathways through which NSAIDs may exert their effects. In this study, immunohistochemical analysis of 29 Barrett's epithelial samples and 60 esophageal adenocarcinomas demonstrated abundant expression of the COX-2 protein in Barrett's epithelium, but marked heterogeneity of expression in esophageal adenocarcinomas. The three esophageal adenocarcinoma cell lines, Flo-1, Bic-1, and Seg-1, also demonstrated varying expression patterns for COX-1 and COX-2. Indomethacin induced apoptosis in all three cell lines, however, in both a time- and dose-dependent manner. In Flo-1 cells, which expressed almost undetectable levels of COX-1 and COX-2, and in Seg-1, which expressed significant levels of COX-1 and COX-2, indomethacin caused upregulation of the pro-apoptotic protein Bax. The upregulation of Bax was accompanied by the translocation of mitochondrial cytochrome c to the cytoplasm, and activation of caspase 9. Pre-treatment of both cell lines with the specific caspase 9 inhibitor, z-LEHD-FMK, as well as the broad-spectrum caspase inhibitor, z-VAD-FMK, blocked the effect of indomethacin-induced apoptosis. These data demonstrate that induction of apoptosis by indomethacin in esophageal adenocarcinoma cells is associated with the upregulation of Bax expression and mitochondrial cytochrome c translocation, and does not correlate with the expression of COX-2. This may have important implications for identifying new therapeutic targets in this deadly disease.
Figures
Figure 1
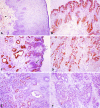
Immunohistochemical analysis of COX-2 protein expression. (A) While the normal squamous esophageal epithelium did not demonstrate expression for COX-2, there was expression seen in cellular components of the stroma in some specimens (arrow). (B) Barrett's metaplasia demonstrating expression of COX-2 within the epithelial and glandular regions of the lamina propria. (C) Expression was also seen in Barrett's epithelium with dysplasia, but strongly dysplastic areas (arrow) appeared to show less immunoreactivity for COX-2 when compared to nondysplastic areas. (D) A highly invasive esophageal adenocarcinoma demonstrating abundant COX-2 protein expression in tumor cells and smooth muscle cells. (E) An esophageal adenocarcinoma demonstrating heterogenous expression of COX-2 within tumor cells. (F) A COX-2-negative adenocarcinoma.
Figure 2
RT-PCR for COX-2 demonstrating the variability in COX-2 expression in different patient samples. Three samples demonstrate COX-2 expression both in the normal esophagus and tumor, while two samples show expression only within the tumor. One sample (L50) demonstrates abundant COX-2 expression in the normal epithelium, but low level expression in the tumor sample. Two patient specimens show either very low level or absent expression in both the normal and tumorous tissues. GAPDH was co-amplified as an internal control and is shown in the upper panels.
Figure 3
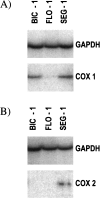
RT-PCR analysis of (A) COX-1 and (B) COX-2 expression in the human esophageal adenocarcinoma cell lines, Bic-1, Flo-1, and Seg-1. GAPDH was co-amplified as an internal control and is shown in the upper panels.
Figure 4
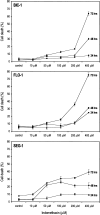
Time and dose-response curves of Bic-1, Flo-1, and Seg-1 to indomethacin. Cells were treated with increasing doses of indomethacin for 24, 48, and 72 hours. At the indicated time points, all cells were harvested and cell viability assessed by a trypan blue exclusion assay. Graphs represent the percentage of nonviable cells of total cells harvested at the indicated time and dose points.
Figure 5
(A) Propidium iodide staining of Bic-1, Flo-1, and Seg-1 cells after treatment with indomethacin (200 µM) for 48 hours. Cells treated with indomethacin (right panels) demonstrate characteristic features of apoptotic death including cellular shrinkage, nuclear condensation and fragmentation. (B) Cell lines treated with 200 µM indomethacin for 48 hours demonstrate evidence of internucleosomal DNA fragmentation when compared to untreated cells C. A low-molecular weight DNA marker is pictured in the far left lane.
Figure 6
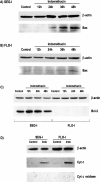
Western blot analysis of Bax, Bcl-2, and cytosolic cytochrome c in Seg-1 and Flo-1 cells after treatment with indomethacin (100 µM). Bax upregulation is seen in both (A) Seg-1 and Flo-1 cells after treatment with indomethacin. (C) Flo-1 cells did not express Bcl-2 protein, and this was not altered by treatment with indomethacin. Bcl-2 was expressed by Seg-1 cells. After 12 hours of treatment, the level of Bcl-2 expression did appear to increase slightly, but levels after 24 and 48 hours of treatment were not significantly different from untreated cells. (D) Western blot analysis of cytosolic extracts demonstrating the translocation of cytochrome c to the cytosol after treatment with 100 µM for 30 hours. As a control for mechanical disruption of mitochondria during harvesting, the presence of cytochrome c oxidase was not detected. β-actin is shown in the upper panels.
Figure 7
Treatment of Flo-1 and Seg-1 cells with the selective caspase 9 inhibitor, Z-LEHD-FMK, and the broad-spectrum caspase inhibitor, z-VAD-FMK. Cells were pretreated with the caspase inhibitors for 12 hours prior to treatment with indomethacin for 60 hours. Viability was assessed by trypan exclusion. To test if the inhibitors alone exerted any cytotoxic effect, cells treated only with the caspase inhibitors were also examined and showed no difference in viability from untreated cells (data not shown). The graphs show nonviable cells expressed as a percentage of the total cell population harvested.
Similar articles
- Selective inhibition of cyclooxygenase-2 suppresses growth and induces apoptosis in human esophageal adenocarcinoma cells.
Souza RF, Shewmake K, Beer DG, Cryer B, Spechler SJ. Souza RF, et al. Cancer Res. 2000 Oct 15;60(20):5767-72. Cancer Res. 2000. PMID: 11059772 - Expression of apoptosis-related proteins in Barrett's metaplasia-dysplasia-carcinoma sequence: a switch to a more resistant phenotype.
van der Woude CJ, Jansen PL, Tiebosch AT, Beuving A, Homan M, Kleibeuker JH, Moshage H. van der Woude CJ, et al. Hum Pathol. 2002 Jul;33(7):686-92. doi: 10.1053/hupa.2002.124908. Hum Pathol. 2002. PMID: 12196918 - Induction of apoptosis by cyclo-oxygenase-2 inhibitor NS398 through a cytochrome C-dependent pathway in esophageal cancer cells.
Li M, Wu X, Xu XC. Li M, et al. Int J Cancer. 2001 Jul 15;93(2):218-23. doi: 10.1002/ijc.1322. Int J Cancer. 2001. PMID: 11410869 - Angiogenic markers, neovascularization and malignant deformation of Barrett's esophagus.
Wilson KT. Wilson KT. Dis Esophagus. 2002;15(1):16-21. doi: 10.1046/j.1442-2050.2002.00212.x. Dis Esophagus. 2002. PMID: 12060038 Review. - p27 and Barrett's esophagus: a review*.
Ellis FH Jr, Loda M. Ellis FH Jr, et al. Dis Esophagus. 2004;17(2):113-7. doi: 10.1111/j.1442-2050.2004.00402.x. Dis Esophagus. 2004. PMID: 15230722 Review.
Cited by
- Review of the molecular profile and modern prognostic markers for gastric lymphoma: how do they affect clinical practice?
Alevizos L, Gomatos IP, Smparounis S, Konstadoulakis MM, Zografos G. Alevizos L, et al. Can J Surg. 2012 Apr;55(2):117-24. doi: 10.1503/cjs.002310. Can J Surg. 2012. PMID: 22564515 Free PMC article. Review. - Molecular Mechanism of Cinnamomum cassia against Gastric Damage and Identification of Active Compounds.
Lee MJ, Seo HJ, Hwang GS, Choi S, Park SJ, Hwang SJ, Kang KS. Lee MJ, et al. Biomolecules. 2022 Mar 30;12(4):525. doi: 10.3390/biom12040525. Biomolecules. 2022. PMID: 35454114 Free PMC article. - Genomic evolution in Barrett's adenocarcinoma cells: critical roles of elevated hsRAD51, homologous recombination and Alu sequences in the genome.
Pal J, Bertheau R, Buon L, Qazi A, Batchu RB, Bandyopadhyay S, Ali-Fehmi R, Beer DG, Weaver DW, Shmookler Reis RJ, Goyal RK, Huang Q, Munshi NC, Shammas MA. Pal J, et al. Oncogene. 2011 Aug 18;30(33):3585-98. doi: 10.1038/onc.2011.83. Epub 2011 Mar 21. Oncogene. 2011. PMID: 21423218 Free PMC article. - Lipoxygenase and cyclooxygenase metabolism: new insights in treatment and chemoprevention of pancreatic cancer.
Ding XZ, Hennig R, Adrian TE. Ding XZ, et al. Mol Cancer. 2003 Jan 7;2:10. doi: 10.1186/1476-4598-2-10. Mol Cancer. 2003. PMID: 12575899 Free PMC article. Review. - COX-Independent Mechanisms of Cancer Chemoprevention by Anti-Inflammatory Drugs.
Gurpinar E, Grizzle WE, Piazza GA. Gurpinar E, et al. Front Oncol. 2013 Jul 11;3:181. doi: 10.3389/fonc.2013.00181. eCollection 2013. Front Oncol. 2013. PMID: 23875171 Free PMC article.
References
- Blot WJ, McLaughlin JK. The changing epidemiology of esophageal cancer. Sem Oncol. 1999;26:2–8. - PubMed
- Thun MJ, Namboodiri MM, Heath CW., Jr Aspirin use and reduced risk of fatal colon cancer. N Engl J Med. 1991;325:1593–1596. - PubMed
- Thun MJ. NSAID use and decreased risk of gastrointestinal cancers. Gastroenterol Clin North Am. 1996;25:333–348. - PubMed
- Narisawa T, Sato M, Tani M, Kudo T, Takahashi T, Goto A. Inhibition of development of methylnitrosourea-induced rat colon tumors by indomethacin treatment. Cancer Res. 1981;41:1954–1957. - PubMed
- Barnes CJ, Lee M. Chemoprevention of spontaneous intestinal adenomas in the adenomatous polyposis coli Min mouse model with aspirin. Gastoenterology. 1998;114:873–877. - PubMed
Publication types
MeSH terms
Substances
LinkOut - more resources
Full Text Sources
Medical
Research Materials


