Manifold anomalies in gene expression in a vineyard isolate of Saccharomyces cerevisiae revealed by DNA microarray analysis - PubMed (original) (raw)
Manifold anomalies in gene expression in a vineyard isolate of Saccharomyces cerevisiae revealed by DNA microarray analysis
D Cavalieri et al. Proc Natl Acad Sci U S A. 2000.
Abstract
Genome-wide transcriptional profiling has important applications in evolutionary biology for assaying the extent of heterozygosity for alleles showing quantitative variation in gene expression in natural populations. We have used DNA microarray analysis to study the global pattern of transcription in a homothallic strain of Saccharomyces cerevisiae isolated from wine grapes in a Tuscan vineyard, along with the diploid progeny obtained after sporulation. The parental strain shows 2:2 segregation (heterozygosity) for three unlinked loci. One determines resistance to trifluoroleucine; another, resistance to copper sulfate; and the third is associated with a morphological phenotype observed as colonies with a ridged surface resembling a filigree. Global expression analysis of the progeny with the filigreed and smooth colony phenotypes revealed a greater than 2-fold difference in transcription for 378 genes (6% of the genome). A large number of the overexpressed genes function in pathways of amino acid biosynthesis (particularly methionine) and sulfur or nitrogen assimilation, whereas many of the underexpressed genes are amino acid permeases. These wholesale changes in amino acid metabolism segregate as a suite of traits resulting from a single gene or a small number of genes. We conclude that natural vineyard populations of S. cerevisiae can harbor alleles that cause massive alterations in the global patterns of gene expression. Hence, studies of expression variation in natural populations, without accompanying segregation analysis, may give a false picture of the number of segregating genes underlying the variation.
Figures
Figure 1
(A) Colony morphologies of the parental strain M28 and the smooth (S1, S2) and filigreed (F1, F2) segregants. The colonies range in size from 1.0 to 1.2 cm. (B) Convoluted surface of a filigreed colony. The diameter of the filament is approximately 0.2 mm.
Figure 2
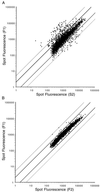
Log-log scatterplot of fluorescence measured for mRNA labeled with either cyanine-3 or cyanine-5 fluorochrome in a competitive hybridization on a microarray containing 6218 ORFs. Spots with at least one fluorescence signal significantly above background are plotted for (A) F1 against S2 and (B) F1 against F2. Dark lines represent a 2-fold difference in expression; light lines represent a 5-fold difference in expression.
Figure 3
Relative expression levels of all genes overexpressed 3-fold or more in comparisons of F1 with S2 (front), F2 with S2 (rear), and F1 with the parental strain M28 (middle). The overexpressed genes are arranged in order of their mean expression level across all three comparisons.
Figure 4
Key steps related to the biosynthesis of methionine. The numbers are the relative levels of expression of the indicated genes.
Similar articles
- Cascading transcriptional effects of a naturally occurring frameshift mutation in Saccharomyces cerevisiae.
Brown KM, Landry CR, Hartl DL, Cavalieri D. Brown KM, et al. Mol Ecol. 2008 Jun;17(12):2985-97. doi: 10.1111/j.1365-294X.2008.03765.x. Epub 2008 Apr 18. Mol Ecol. 2008. PMID: 18422925 - Genome-wide expression analysis of genes affected by amino acid sensor Ssy1p in Saccharomyces cerevisiae.
Kodama Y, Omura F, Takahashi K, Shirahige K, Ashikari T. Kodama Y, et al. Curr Genet. 2002 May;41(2):63-72. doi: 10.1007/s00294-002-0291-1. Epub 2002 May 7. Curr Genet. 2002. PMID: 12073087 - Whole genome sequencing of Saccharomyces cerevisiae: from genotype to phenotype for improved metabolic engineering applications.
Otero JM, Vongsangnak W, Asadollahi MA, Olivares-Hernandes R, Maury J, Farinelli L, Barlocher L, Osterås M, Schalk M, Clark A, Nielsen J. Otero JM, et al. BMC Genomics. 2010 Dec 22;11:723. doi: 10.1186/1471-2164-11-723. BMC Genomics. 2010. PMID: 21176163 Free PMC article. - Metabolism of sulfur amino acids in Saccharomyces cerevisiae.
Thomas D, Surdin-Kerjan Y. Thomas D, et al. Microbiol Mol Biol Rev. 1997 Dec;61(4):503-32. doi: 10.1128/mmbr.61.4.503-532.1997. Microbiol Mol Biol Rev. 1997. PMID: 9409150 Free PMC article. Review. - Multiplicity of regulatory mechanisms controlling amino acid biosynthesis in Saccharomyces cerevisiae.
Messenguy F. Messenguy F. Microbiol Sci. 1987 May;4(5):150-3. Microbiol Sci. 1987. PMID: 3153190 Review.
Cited by
- The genetic basis of natural variation in oenological traits in Saccharomyces cerevisiae.
Salinas F, Cubillos FA, Soto D, Garcia V, Bergström A, Warringer J, Ganga MA, Louis EJ, Liti G, Martinez C. Salinas F, et al. PLoS One. 2012;7(11):e49640. doi: 10.1371/journal.pone.0049640. Epub 2012 Nov 21. PLoS One. 2012. PMID: 23185390 Free PMC article. - Gene-expression changes caused by inbreeding protect against inbreeding depression in Drosophila.
García C, Avila V, Quesada H, Caballero A. García C, et al. Genetics. 2012 Sep;192(1):161-72. doi: 10.1534/genetics.112.142687. Epub 2012 Jun 19. Genetics. 2012. PMID: 22714404 Free PMC article. - Comparative transcriptomic analysis reveals similarities and dissimilarities in Saccharomyces cerevisiae wine strains response to nitrogen availability.
Barbosa C, García-Martínez J, Pérez-Ortín JE, Mendes-Ferreira A. Barbosa C, et al. PLoS One. 2015 Apr 17;10(4):e0122709. doi: 10.1371/journal.pone.0122709. eCollection 2015. PLoS One. 2015. PMID: 25884705 Free PMC article. - Exploiting natural variation in Saccharomyces cerevisiae to identify genes for increased ethanol resistance.
Lewis JA, Elkon IM, McGee MA, Higbee AJ, Gasch AP. Lewis JA, et al. Genetics. 2010 Dec;186(4):1197-205. doi: 10.1534/genetics.110.121871. Epub 2010 Sep 20. Genetics. 2010. PMID: 20855568 Free PMC article. - Population genetic variation in gene expression is associated with phenotypic variation in Saccharomyces cerevisiae.
Fay JC, McCullough HL, Sniegowski PD, Eisen MB. Fay JC, et al. Genome Biol. 2004;5(4):R26. doi: 10.1186/gb-2004-5-4-r26. Epub 2004 Mar 24. Genome Biol. 2004. PMID: 15059259 Free PMC article.
References
- Lockhart D J, Dong H, Byrne M C, Follettie M T, Gallo M V, Chee M S, Mittmann M, Wang C, Kobayashi M, Horton H, et al. Nat Biotechnol. 1996;14:1675–1680. - PubMed
- Wodicka L, Dong H L, Mittmann M, Ho M H, Lockhart D J. Nat Biotechnol. 1997;15:1359–1367. - PubMed
- DeRisi J L, Iyer V R, Brown P O. Science. 1997;278:680–686. - PubMed
Publication types
MeSH terms
Substances
LinkOut - more resources
Full Text Sources
Other Literature Sources
Molecular Biology Databases


