Denaturing gradient gel electrophoresis analysis of 16S ribosomal DNA amplicons to monitor changes in fecal bacterial populations of weaning pigs after introduction of Lactobacillus reuteri strain MM53 - PubMed (original) (raw)
Denaturing gradient gel electrophoresis analysis of 16S ribosomal DNA amplicons to monitor changes in fecal bacterial populations of weaning pigs after introduction of Lactobacillus reuteri strain MM53
J M Simpson et al. Appl Environ Microbiol. 2000 Nov.
Abstract
The diversity and stability of the fecal bacterial microbiota in weaning pigs was studied after introduction of an exogenous Lactobacillus reuteri strain, MM53, using a combination of cultivation and techniques based on genes encoding 16S rRNA (16S rDNA). Piglets (n = 9) were assigned to three treatment groups (control, daily dosed, and 4th-day dosed), and fresh fecal samples were collected daily. Dosed animals received 2.5 x 10(10) CFU of antibiotic-resistant L. reuteri MM53 daily or every 4th day. Mean Lactobacillus counts for the three groups ranged from 1 x 10(9) to 4 x 10(9) CFU/g of feces. Enumeration of strain L. reuteri MM53 on MRS agar (Difco) plates containing streptomycin and rifampin showed that the introduced strain fluctuated between 8 x 10(3) and 5 x 10(6) CFU/g of feces in the two dosed groups. Denaturing gradient gel electrophoresis (DGGE) of PCR-amplified 16S rDNA fragments, with primers specific for variable regions 1 and 3 (V1 and V3), was used to profile complexity of fecal bacterial populations. Analysis of DGGE banding profiles indicated that each individual maintained a unique fecal bacterial population that was stable over time, suggesting a strong host influence. In addition, individual DGGE patterns could be separated into distinct time-dependent clusters. Primers designed specifically to restrict DGGE analysis to a select group of lactobacilli allowed examination of interspecies relationships and abundance. Based on relative band migration distance and sequence determination, L. reuteri was distinguishable within the V1 region 16S rDNA gene patterns. Daily fluctuations in specific bands within these profiles were observed, which revealed an antagonistic relationship between L. reuteri MM53 (band V1-3) and another indigenous Lactobacillus assemblage (band V1-6).
Figures
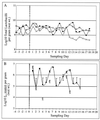
FIG. 1
Total Lactobacillus (A) and L. reuteri MM53 (B) populations in daily fecal samples obtained from piglets for control (×), daily-dosed (●), and 4th-day-dosed (□) groups.
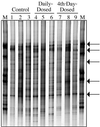
FIG. 2
PCR-DGGE profile generated from fecal samples obtained from individual piglets on day 15 using primers specific for the V3-16S rDNA region showing diversity of banding patterns present in each animal. Bacterial standard marker lanes are denoted as M. Lanes 1 to 3 are from the control group, lanes 4 to 6 are from the daily-dosed piglet group, and lanes 7 to 9 are from the 4th-day-dosed piglet group. Arrows indicate bands which are common to most piglet fecal samples.
FIG. 3
PCR-DGGE profile generated from fecal samples obtained from an individual piglet (E2) over the 20-day experimental period using primers specific for the V3-16S rDNA region showing stability of banding patterns within individual animal. Lanes −1 through 18 correspond to sampling days. Bacterial standard marker lanes are denoted as M.
FIG. 4
Tukey plots of V3-16S rDNA region similarity coefficients (n = 190 each) calculated within individuals for fecal samples collected daily from piglets in control, daily-dosed, and 4th-day-dosed groups. Means are indicated as solid squares; the 25th, 50th, and 75th percentile data are indicated as the bottom, middle, and top edges of the boxes, respectively; the 10th and 90th percentiles are indicated as whiskers; and the extreme data points are indicated as circles. Letter and number designations on the x axis refer to individual animal identification numbers.
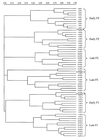
FIG. 5
Dendrogram illustrating the correlation between animal-to-animal variation in V3-16S rDNA region banding patterns. The three piglets (F1, F2, and F3) represented are from the 4th-day-dosing group. Numbers indicate the sampling day with individual animal designations shown within parentheses. Marker bars (●——●) indicate divisions between individual piglet pattern groups. Brackets indicate the two major time period pattern separations (early and late) that occur within each animal's pattern group. Dendrogram distances are in arbitrary units.
FIG. 6
Successional changes in fecal bacterial populations for control, daily-dosed, and 4th-day-dosed groups based on cluster analysis of temporal PCR-DGGE banding patterns. Profiles were separated into start ( ), early (
 ), middle (
 ), and late (
 ) time phases according to their cluster patterns generated using Ward's algorithm. The experimental dosing protocol was carried out as described in Materials and Methods between days 1 and 13 indicated by the vertical arrows. Dosing days for the 4th-day-dosed group are boxed.
FIG. 7
(A) PCR-DGGE pattern obtained using _Lactobacillus_-specific V1-16S rDNA primers. A box indicates the L. reuteri band used to track changes in this population. Lanes: 1, pure culture L. reuteri MM53; 2, control piglet fecal sample; 3, daily-dosed piglet fecal sample. Band numbers correspond to different Lactobacillus species as follows: 1, Lactobacillus sp., 2, L. reuteri; 3, L. reuteri; 4, L. pontis; 5, L. panis; 6, Lactobacillus sp. (B) Contribution of L. reuteri band V1-3 intensities from V1-16S rDNA region DGGE gels expressed as a percentage of total density (V1 through V6) for the three treatment groups (control [▴], daily dosed [□], and 4th day dosed [●]). Dosing days for the 4th-day-dosed group are boxed, and the last dosing day is indicated by the dotted line.
FIG. 8
Tukey plot of V1-16S rDNA region similarity coefficients (n = 190 each) calculated within individuals for fecal samples collected daily from piglets in control, daily-dosed, and 4th-day-dosed groups. Means are indicated as solid squares; the 25th, 50th, and 75th percentile data are indicated as the bottom, middle, and top edges of the boxes, respectively; the 10th and 90th percentiles are indicated as whiskers; and the extreme data points are indicated as circles. Letter and number designations on the x axis refer to individual piglet identification numbers.
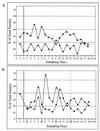
FIG. 9
Comparison of intensities of V1-3 band (L. reuteri) (▴) with V1-6 band (Lactobacillus sp. (●) in a control animal (D2) showing a counteroscillation pattern over the duration of the experiment (A) and for a 4th-day-dosed piglet (F2) showing a dosage-altered pattern (B). For clarity only two of the six possible bands are included in panels (A) and (B). Dosing days for the 4th-day-dosed piglets are boxed, and the last dosing day is indicated by the broken line.
Similar articles
- 16S ribosomal RNA-based methods to monitor changes in the hindgut bacterial community of piglets after oral administration of Lactobacillus sobrius S1.
Su Y, Yao W, Perez-Gutierrez ON, Smidt H, Zhu WY. Su Y, et al. Anaerobe. 2008 Apr;14(2):78-86. doi: 10.1016/j.anaerobe.2007.12.004. Epub 2008 Jan 5. Anaerobe. 2008. PMID: 18272412 Clinical Trial. - Changes in the diversity of pig ileal lactobacilli around weaning determined by means of 16S rRNA gene amplification and denaturing gradient gel electrophoresis.
Janczyk P, Pieper R, Smidt H, Souffrant WB. Janczyk P, et al. FEMS Microbiol Ecol. 2007 Jul;61(1):132-40. doi: 10.1111/j.1574-6941.2007.00317.x. Epub 2007 Apr 11. FEMS Microbiol Ecol. 2007. PMID: 17428304 - [Tracking of the development of fecal bacterial community of diarrhea piglets by 16S rDNA techniques].
Yao W, Zhu WY, Mao SY. Yao W, et al. Wei Sheng Wu Xue Bao. 2006 Feb;46(1):150-3. Wei Sheng Wu Xue Bao. 2006. PMID: 16579485 Chinese. - [Development of bacterial community in faeces of weaning piglets as revealed by denaturing gradient gel electrophoresis].
Zhu W, Yao W, Mao S. Zhu W, et al. Wei Sheng Wu Xue Bao. 2003 Aug;43(4):503-8. Wei Sheng Wu Xue Bao. 2003. PMID: 16276927 Chinese. - [Species and strain specific identification of lactic acid bacteria in complex microflora].
Hertel C, Meroth CB. Hertel C, et al. Berl Munch Tierarztl Wochenschr. 2003 Nov-Dec;116(11-12):517-23. Berl Munch Tierarztl Wochenschr. 2003. PMID: 14655632 Review. German.
Cited by
- Influence of dietary n-3 long-chain fatty acids on microbial diversity and composition of sows' feces, colostrum, milk, and suckling piglets' feces.
Llauradó-Calero E, Climent E, Chenoll E, Ballester M, Badiola I, Lizardo R, Torrallardona D, Esteve-Garcia E, Tous N. Llauradó-Calero E, et al. Front Microbiol. 2022 Dec 5;13:982712. doi: 10.3389/fmicb.2022.982712. eCollection 2022. Front Microbiol. 2022. PMID: 36545207 Free PMC article. - Molecular monitoring of succession of bacterial communities in human neonates.
Favier CF, Vaughan EE, De Vos WM, Akkermans AD. Favier CF, et al. Appl Environ Microbiol. 2002 Jan;68(1):219-26. doi: 10.1128/AEM.68.1.219-226.2002. Appl Environ Microbiol. 2002. PMID: 11772630 Free PMC article. - Effects of dietary fat source and subtherapeutic levels of antibiotic on the bacterial community in the ileum of broiler chickens at various ages.
Knarreborg A, Simon MA, Engberg RM, Jensen BB, Tannock GW. Knarreborg A, et al. Appl Environ Microbiol. 2002 Dec;68(12):5918-24. doi: 10.1128/AEM.68.12.5918-5924.2002. Appl Environ Microbiol. 2002. PMID: 12450811 Free PMC article. - Enteroendocrine peptides, growth, and the microbiome during the porcine weaning transition.
Ramsay TG, Arfken AM, Summers KL. Ramsay TG, et al. Anim Microbiome. 2022 Nov 18;4(1):56. doi: 10.1186/s42523-022-00206-8. Anim Microbiome. 2022. PMID: 36401290 Free PMC article. - Community dynamics in the mouse gut microbiota: a possible role for IRF9-regulated genes in community homeostasis.
Thompson CL, Hofer MJ, Campbell IL, Holmes AJ. Thompson CL, et al. PLoS One. 2010 Apr 23;5(4):e10335. doi: 10.1371/journal.pone.0010335. PLoS One. 2010. PMID: 20428250 Free PMC article.
References
- Axelsson L, Lindgren S. Characterization and DNA homology of Lactobacillus strains isolated from pig intestine. J Appl Bacteriol. 1987;62:433–440. - PubMed
- Bryant M P. Commentary on the Hungate technique for culture of anaerobic bacteria. Am J Clin Nutr. 1972;25:1324–1328. - PubMed
- Casas I, Dobrogosz W. Lactobacillus reuteri: overview of a new probiotic for humans and animals. Microecol Ther. 1997;26:221–231.
- Gaskins H R. Intestinal bacteria and their influence on swine growth. In: Lewis A J, Southern L L, editors. Swine Nutrition, in press. Boca Raton, Fla: CRC Press; 2000.
Publication types
MeSH terms
Substances
LinkOut - more resources
Full Text Sources
Other Literature Sources
Medical


