Firing patterns and correlations of spontaneous discharge of pallidal neurons in the normal and the tremulous 1-methyl-4-phenyl-1,2,3,6-tetrahydropyridine vervet model of parkinsonism - PubMed (original) (raw)
Firing patterns and correlations of spontaneous discharge of pallidal neurons in the normal and the tremulous 1-methyl-4-phenyl-1,2,3,6-tetrahydropyridine vervet model of parkinsonism
A Raz et al. J Neurosci. 2000.
Abstract
To investigate the role of the basal ganglia in parkinsonian tremor, we recorded hand tremor and simultaneous activity of several neurons in the external and internal segments of the globus pallidus (GPe and GPi) in two vervet monkeys, before and after systemic treatment with 1-methyl-4-phenyl-1,2,3,6-tetrahydropyridine (MPTP) and development of parkinsonism with tremor of 5 and 11 Hz. In healthy monkeys, only 11% (20/174) of the GPe cells and 3% (1/29) of the GPi cells displayed significant 3-19 Hz oscillations. After MPTP treatment, 39% (107/271) of the GPe cells and 43% (26/61) of the GPi cells developed significant oscillations. Oscillation frequencies of single cells after MPTP treatment were bimodally distributed around 7 and 13 Hz. For 10% of the oscillatory cells that were recorded during tremor periods, there was a significant tendency for the tremor and neuronal oscillations to appear simultaneously. Cross-correlation analysis revealed a very low level of correlated activity between pallidal neurons in the normal state; 95.6% (477/499) of the pairs were not correlated, and oscillatory cross-correlograms were found in only 1% (5/499) of the pairs. After MPTP treatment, the correlations increased dramatically, and 40% (432/1080) of the cross-correlograms had significant oscillations, centered around 13-14 Hz. Phase shifts of the cross-correlograms of GPe pairs, but not of GPi, were clustered around 0 degrees. The results illustrate that MPTP treatment changes the pattern of activity and synchronization in the GPe and GPi. These changes are related to the symptoms of Parkinson's disease and especially to the parkinsonian tremor.
Figures
Fig. 1.
Spontaneous movements are reduced after MPTP treatment. The monkey's spontaneous movements in its home cage were measured daily using two reflected sonar beams. Each session lasted 30 min, and each channel was sampled at 100 Hz. A,B, Examples of spontaneous movements of monkey H before and after MPTP treatment, respectively. C,D, SDs of sonar traces of monkeys H and I, respectively, before and after MPTP treatment. Marked areas represent the MPTP injection days (no recordings were performed during that time). ⋄ and asterisks represent horizontal and vertical sonar beams, respectively.
Fig. 2.
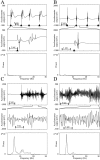
Examples of normal movements and tremor.A, B, Accelerometer recording from monkeys H and I, respectively, in the normal state during task performance. C, D, Accelerometer recording from monkeys H and I, respectively, after MPTP treatment.Top traces display a segment of accelerometer output sampled at 100 Hz. Black arrowhead represents the release of the central key (beginning of movement). Middle traces show an enlargement of 5 sec from the top trace. The bottom plots depict the power spectra of the corresponding top traces.
Fig. 3.
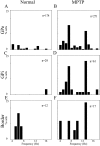
Distribution of the frequencies of significant peaks in the power spectra of segments of accelerometer recordings. Only peaks with SNR >3 SD are included. Segment duration was 2.56 sec. Data of both monkeys were lumped together. A, Distribution in the normal state, n = 79,761 segments. B, Distribution after MPTP treatment,n = 111,755 segments.
Fig. 4.
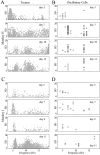
Evolution of tremor and oscillatory activity after MPTP treatment. Each box contains the results of one recording day. In the left column, each point represents a significant tremor segment (duration: 2.56 sec). In the right column, each circle represents a neuron with significant average oscillations. Only peaks between 3 and 19 Hz are shown. A, C, Tremor recorded from monkeys H and I, respectively. B, D, Oscillatory GP cells recorded from monkeys H and I, respectively. The number of days after the last MPTP injection is written on each plot. In both monkeys the tremor in the first few days was mainly ∼4–6 Hz, but as time evolved tremor appeared in the higher frequencies (10–14 Hz) as well. The oscillatory activity of neurons behaved in a similar fashion. This was more pronounced in monkey H, which was more severely parkinsonian than monkey I.
Fig. 5.
Average firing rates of pallidal cells in the normal and parkinsonian state. A, Monkey H.B, Monkey I. Mean firing rates of well isolated cells and SEM are given in brackets. Error bars represent the SEM. Open bars are the mean firing rate of cells recorded in the normal state; black bars are after MPTP treatment. The bars on left are for GPe cells, bars in middle are for GPi cells, and bars on right are for border cells. The number of cells is given in Table 1. *Significant difference at_p_ < 0.01, t test.
Fig. 6.
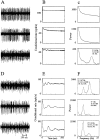
Examples of raw data, autocorrelograms, and power spectra of GP cells. A_–_C, Cells recorded in the normal state. Top and bottom traces are of GPi cells, and middle trace is of GPe cell. D_–_F, Cells were recorded in the MPTP-treated state; all of the correlograms shown are of GPe cells.A, D, Examples of 2 sec of raw data.B, E, Autocorrelograms of the respective cell. C, F, Power spectra of the respective autocorrelograms. Raw data are filtered at 300–5000 Hz and sampled at 12,000 Hz. Autocorrelograms are calculated for 500 msec, using 1 msec bins. The power spectrum is calculated by taking the Fourier transform of the autocorrelograms from time −500 to 500 msec after removing the trough around time 0 and after subtracting the average firing rate. The details of each cell with significant oscillations are given on the power spectrum graph. F, Frequency of the significant peaks; S, signal-to-noise ratio; OI, oscillation index. In cases with more than one significant peak, the details of the peaks appear in the order of their strength.
Fig. 7.
Percentage of oscillatory cells in the normal and parkinsonian state. A, Monkey H. B, Monkey I. Percentages of oscillatory cells are plotted as_bars_. Numbers of oscillatory cells of all recorded cells are given in brackets. Open bars are cells recorded in the normal state; black bars are after MPTP treatment. Left two bars are for GPe cells,middle two bars are for GPi cells, and right two bars for border cells. *Significant difference at_p_ < 0.05, χ2 test. **Significant difference at p < 0.01, χ2test.
Fig. 8.
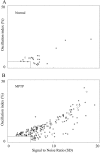
Oscillation strength of GP cells in normal and parkinsonian state. The _x_-axis is the signal-to-noise ratio; the _y_-axis is the oscillation index. Only significant peaks with frequency of 3–19 Hz are shown. A peak is significant if SNR is >5 SD or OI is >5%. A, Oscillations in the normal monkeys. B, Oscillations in the MPTP-treated monkeys. *, GPe cells; ○, GPi cells; ▿, border cells.
Fig. 9.
Distribution of the oscillation frequencies of single cells. Frequencies of all the significant peaks between 3 and 19 Hz in the power spectra of the autocorrelograms are shown. The distribution is given as percentage of oscillatory cells of all the cells recorded in the specific nucleus and state. A,B, GPe in the normal and MPTP-treated state, respectively. C, D, GPi in the normal and MPTP-treated state, respectively. E, F, Border cells in the normal and MPTP-treated state, respectively. The total number of cells recorded in each nucleus and state is listed in the top right corner.
Fig. 10.
Relationship between the first oscillation frequency and second oscillation frequency of correlograms with more than one significant oscillation frequency. A, Autocorrelograms. B, Cross-correlograms._x_-axis represents the frequency of oscillation frequencies with the highest peak in the power spectrum, and_y_-axis represents the frequency of the second peak. We jittered the data points by a random value of ±0–0.2 Hz horizontally and vertically to allow the reader to estimate the number of data points in each location. The lines on the graphs represent the cases in which one frequency is a multiplication of the second (y = 2x, y = 0.5x).
Fig. 11.
Examples of simultaneous recordings of the activity of a number of cells in the globus pallidus. Electrode output filtered at 300–5000 Hz and sampled at 12,000 Hz. A, Normal monkey. B, MPTP-treated monkey. Auto- and cross-correlograms of these cells are given in Figures 12 and15_B_.
Fig. 12.
Auto- and cross-correlograms with power spectra of GP cells in a normal monkey. A, Autocorrelograms.B, Cross-correlation matrix. Identification of the trigger unit appears at the top, and identification of the reference unit appears at the left. Bin size was 1 msec, and no smoothing was performed. The _y_-axis displays conditional firing rate. C, Power spectra of all the autocorrelograms (top) and cross-correlograms (bottom). Cells 9 (Unit 9) and 17 (Unit 17) were from the GPe, and cells 13 (Unit 13) and 25 (Unit 25) were from the GPi. AC, Autocorrelograms; CC, cross-correlograms.
Fig. 13.
Percentage of significant non-flat and oscillatory cross-correlograms. A, C, Monkey H. B, D, Monkey I.A, B, Significant non-flat cross-correlograms. C, D, Significant oscillations. Percentages of significant correlograms are plotted as_bars_. Numbers of significant correlograms of all recorded pairs are given in brackets. Open bars are of pairs recorded in the normal state; black bars are after MPTP treatment. Column order from_left_ to right: GPe–GPe pairs, GPe–GPi pairs, GPe–border pairs, GPi–GPi pairs, GPi–border pairs, and border–border pairs. *Significant difference at p< 0.05, χ2 test. **Significant difference at_p_ < 0.01, χ2 test. ***Significant difference at p < 0.001, χ2test.
Fig. 14.
Cross-correlogram of two GPe cells in an MPTP-treated monkey. Layout is as in Fig. 8. Inset, Power spectrum of the cross-correlogram. This pair displays significant oscillations, but there is no significant peak or trough. Details characterizing the oscillation are given on the graph:F, frequency of oscillatory correlograms;p, phase shift in degrees; S, signal-to-noise ratio; OI, oscillation index.
Fig. 15.
Cross-correlograms and their spectra in the MPTP-treated state. A, B, Auto- and cross-correlograms with power spectra of GP cells in MPTP-treated monkeys. All of the cross-correlograms have multiple significant peaks or troughs, and all of them have significant oscillations. Notice in_A_ that cell 27 (Unit 27) is not in phase with all other cells, whereas in B all cells are phase-locked. In A, cells 8 (Unit 8) and 23 (Unit 23) were from GPe and cells 17 (Unit 17) and 27 (Unit 27) were from GPi. In B, all of the cells were from the GPe. Layout of_A_ and B is as in Fig. 12. Details characterizing the oscillations are given on the graph:F, frequency of oscillatory correlograms;p, phase shift in degrees; S, signal-to-noise ratio; OI, oscillation index. In cases with more than one significant peak, the details of the peaks appear in order of their strength; AC = autocorrelograms;CC = cross-correlograms. C, Distribution of the frequencies of oscillatory cross-correlograms in the MPTP-treated state. D, Distribution of the phase shifts of oscillatory cross-correlograms in the MPTP-treated state. In_C_ and D the y_-axis shows percentage of oscillatory correlograms of all the correlograms recorded from each combination of nuclei. The total number of pairs recorded from each nuclei pair is listed in the_graphs.
Fig. 16.
An example of the activity of a GPi cell recorded simultaneously with tremor. The recordings are from monkey I in the MPTP-treated state. A, D, Five seconds of simultaneous recordings. The top trace is the spike train, the middle trace is the spike train smoothed with a digital Hamming window 20 msec wide, and the bottom trace is the accelerometer output. B,E, One second of data from A and_D_. It can be seen in B that the spike train and the tremor are correlated, whereas in E they are not. C, F, Power spectra of the two signals and their coherence function. The spectral analysis was performed over the entire recording segments (23.8 and 34.7 sec for the_left_ and right segments, respectively).
Similar articles
- Dopamine replacement therapy does not restore the full spectrum of normal pallidal activity in the 1-methyl-4-phenyl-1,2,3,6-tetra-hydropyridine primate model of Parkinsonism.
Heimer G, Rivlin-Etzion M, Bar-Gad I, Goldberg JA, Haber SN, Bergman H. Heimer G, et al. J Neurosci. 2006 Aug 2;26(31):8101-14. doi: 10.1523/JNEUROSCI.5140-05.2006. J Neurosci. 2006. PMID: 16885224 Free PMC article. - Computational physiology of the basal ganglia in Parkinson's disease.
Rivlin-Etzion M, Elias S, Heimer G, Bergman H. Rivlin-Etzion M, et al. Prog Brain Res. 2010;183:259-73. doi: 10.1016/S0079-6123(10)83013-4. Prog Brain Res. 2010. PMID: 20696324 - Dopamine replacement therapy reverses abnormal synchronization of pallidal neurons in the 1-methyl-4-phenyl-1,2,3,6-tetrahydropyridine primate model of parkinsonism.
Heimer G, Bar-Gad I, Goldberg JA, Bergman H. Heimer G, et al. J Neurosci. 2002 Sep 15;22(18):7850-5. doi: 10.1523/JNEUROSCI.22-18-07850.2002. J Neurosci. 2002. PMID: 12223537 Free PMC article. - Mechanism of parkinsonian neuronal oscillations in the primate basal ganglia: some considerations based on our recent work.
Nambu A, Tachibana Y. Nambu A, et al. Front Syst Neurosci. 2014 May 23;8:74. doi: 10.3389/fnsys.2014.00074. eCollection 2014. Front Syst Neurosci. 2014. PMID: 24904309 Free PMC article. Review. - [Physiopathology of parkinsonism and dyskinesias: lessons from surgical observations]].
Linazasoro G. Linazasoro G. Neurologia. 2001 Jan;16(1):17-29. Neurologia. 2001. PMID: 11234658 Review. Spanish.
Cited by
- Effects of pallidal neurotensin on haloperidol-induced parkinsonian catalepsy: behavioral and electrophysiological studies.
Xue Y, Chen L. Xue Y, et al. Neurosci Bull. 2010 Oct;26(5):345-54. doi: 10.1007/s12264-010-0518-y. Neurosci Bull. 2010. PMID: 20882060 Free PMC article. - Subthalamic nucleus stabilizes movements by reducing neural spike variability in monkey basal ganglia.
Hasegawa T, Chiken S, Kobayashi K, Nambu A. Hasegawa T, et al. Nat Commun. 2022 Apr 25;13(1):2233. doi: 10.1038/s41467-022-29750-2. Nat Commun. 2022. PMID: 35468893 Free PMC article. - Conditions for the generation of beta oscillations in the subthalamic nucleus-globus pallidus network.
Holgado AJ, Terry JR, Bogacz R. Holgado AJ, et al. J Neurosci. 2010 Sep 15;30(37):12340-52. doi: 10.1523/JNEUROSCI.0817-10.2010. J Neurosci. 2010. PMID: 20844130 Free PMC article. - Intrinsic and integrative properties of substantia nigra pars reticulata neurons.
Zhou FM, Lee CR. Zhou FM, et al. Neuroscience. 2011 Dec 15;198:69-94. doi: 10.1016/j.neuroscience.2011.07.061. Epub 2011 Aug 2. Neuroscience. 2011. PMID: 21839148 Free PMC article. Review. - Deep brain stimulation of the globus pallidus internus in the parkinsonian primate: local entrainment and suppression of low-frequency oscillations.
McCairn KW, Turner RS. McCairn KW, et al. J Neurophysiol. 2009 Apr;101(4):1941-60. doi: 10.1152/jn.91092.2008. Epub 2009 Jan 21. J Neurophysiol. 2009. PMID: 19164104 Free PMC article.
References
- Albin RL, Young AB, Penney JB. The functional anatomy of basal ganglia disorders. Trends Neurosci. 1989;12:366–375. - PubMed
- Bedenbaugh P, Gerstein GL. Multiunit normalized cross correlation differs from the average single-unit normalized correlation. Neural Comput. 1997;9:1265–1275. - PubMed
- Bergman H, Wichmann T, DeLong MR. Reversal of experimental parkinsonism by lesions of the subthalamic nucleus. Science. 1990;249:1436–1438. - PubMed
- Bergman H, Wichmann T, Karmon B, DeLong MR. The primate subthalamic nucleus. II. Neuronal activity in the MPTP model of parkinsonism. J Neurophysiol. 1994;72:507–520. - PubMed
- Bergman H, Feingold A, Nini A, Raz A, Slovin H, Abeles M, Vaadia E. Physiological aspects of information processing in the basal ganglia of normal and parkinsonian primates. Trends Neurosci. 1998a;21:32–38. - PubMed
Publication types
MeSH terms
Substances
LinkOut - more resources
Full Text Sources
Other Literature Sources
Medical

