Forkhead transcription factors are critical effectors of cell death and cell cycle arrest downstream of PTEN - PubMed (original) (raw)
Forkhead transcription factors are critical effectors of cell death and cell cycle arrest downstream of PTEN
N Nakamura et al. Mol Cell Biol. 2000 Dec.
Abstract
PTEN acts as a tumor suppressor, at least in part, by antagonizing phosphoinositide 3-kinase (PI3K)/Akt signaling. Here we show that Forkhead transcription factors FKHRL1 and FKHR, substrates of the Akt kinase, are aberrantly localized to the cytoplasm and cannot activate transcription in PTEN-deficient cells. Restoration of PTEN function restores FKHR to the nucleus and restores transcriptional activation. Expression of a constitutively active form of FKHR that cannot be phosphorylated by Akt produces the same effect as reconstitution of PTEN on PTEN-deficient tumor cells. Specifically, activated FKHR induces apoptosis in cells that undergo PTEN-mediated cell death and induces G(1) arrest in cells that undergo PTEN-mediated cell cycle arrest. Furthermore, both PTEN and constitutively active FKHR induce p27(KIP1) protein but not p21. These data suggest that Forkhead transcription factors are critical effectors of PTEN-mediated tumor suppression.
Figures
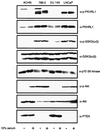
FIG. 1
Immunoblot detection of Akt substrates in PTEN-null cells. Whole-cell extracts were prepared from the indicated serum-starved or serum-stimulated cells and separated by gel electrophoresis. Separated proteins were transferred to nitrocellulose. Membranes were incubated with the indicated immune reagents, and bound antibody was detected by enhanced chemiluminescence. For GSK3, serum stimulation was carried out for 10 min, while for the remaining blots, the cells were stimulated for 90 min. In certain instances the lane order was change for clarity.
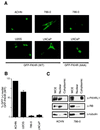
FIG. 2
FKHR is mislocalized in PTEN-null cells. (A) Fluorescence microscopy of GFP-FKHR in PTEN-plus and PTEN-null cells. The indicated cells were transiently transfected, as described in Materials and Methods, with a plasmid encoding GFP-FKHR or GFP-FKHR;AAA. At 24 h after transfection, GFP-FKHR was detected by fluorescence microscopy in living cells. (B) Quantification of the results obtained with GFP-FKHR as shown in panel A. The percentage of cells with nuclear localization of GFP-FKHR was determined by manual counting of GFP-positive nuclei. Data shown are the mean and standard error of duplicate experiments and are representative of two independent experiments. (C) Localization of FKHRL1 in 786-O and ACHN cells. 786-O and ACHN cells were fractionated into cytoplasmic and nuclear compartments by hypotonic lysis and Dounce homogenization. Equivalent cell fractions were loaded on the gel and immunoblotted with anti-FKHRL1, anti-β-tubulin, and anti-pRB antibodies as indicated.
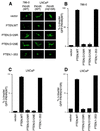
FIG. 3
Reconstitution of PTEN relocalizes GFP-FKHR to the nucleus. (A) Cellular localization of GFP-FKHR in 786-O and LNCaP cells. 786-O cells were transiently transfected with pCDNA3-GFP-FKHR along with pSG5L or pSG5L-PTEN or plasmids encoding the indicated mutant derivatives. Similarly, LNCaP cells were transiently cotransfected with pCDNA3-GFP-FKHR or GFP-FKHR;H215R along with pSG5L plasmid encoding the indicated PTEN cDNAs. At 24 h after transfection, GFP-FKHR was detected by fluorescence microscopy in living cells. (B) Quantitation of the results from panel A (left). The percentage of cells with nuclear GFP-FKHR was determined as in Fig. 2B. The mean and standard error for experimental duplicates are shown, and the results obtained are representative of the results obtained in three independent experiments. (C) Quantification of the results from panel A (middle). Data are shown as in panel B. (D) Quantification of the results from panel A (right). Data are shown as in panel B.
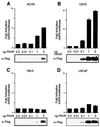
FIG. 4
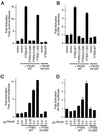
FKHR-dependent transcriptional activation is defective in PTEN-null cells. (A and B) FKHR transactivates the 3×IRS promoter in ACHN and U2-OS cells. ACHN (A) and U2-OS (B) cells were transiently cotransfected with 3×IRS-luciferase reporter plasmids along with either pCDNA3 vector or with the indicated amounts of pCDNA3-Flag-FKHR. In each transfection, a constant amount of pCMX-βGal plasmid was included. At 36 h after transfection, luciferase activity was determined as described in Materials and Methods. Fold activation was calculated by normalizing the measured light units by the measured β-galactosidase activity and then normalizing to the activity of the 3×IRS-promoter luciferase construct when transfected with vector alone. Data shown are the mean and standard error of independent duplicate experiments and are representative of three independent experiments. (C and D) FKHR fails to activate transcription in 786-O and LNCaP cells. 786-O (C) and LNCaP (D) cells were transiently cotransfected with a 3×IRS-luciferase reporter plasmid and either vector or pCDNA3-Flag-FKHR as in panels A and B. Data are shown as for panels A and B.
FIG. 5
Reconstitution of PTEN restores FKHR transcriptional activation. (A and B) Wild-type PTEN and PTEN;1–353 restore transcriptional activation of FKHR in 786-O cells. 786-O cells were transiently cotransfected with either the FasL promoter-luciferase reporter plasmid (A) or the 3×IRS promoter-luciferase reporter plasmid (B) along with plasmids encoding the indicate proteins. Data are shown in Fig. 4A. (C and D) Wild-type PTEN, but not PTEN;G129R, rescues dose-dependent FKHR transactivation. 786-O cells were cotransfected with either the FasL promoter-luciferase reporter plasmid (C) or the 3×IRS promoter luciferase plasmid (D) along with plasmids encoding the indicated proteins. Data are shown as for Fig. 4A.
FIG. 6
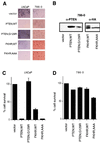
FKHR induces cell death in PTEN-null LNCaP cells but not PTEN-null 786-O cells. (A) 786-O and LNCaP cells were infected with retroviruses directing the expression of the indicated proteins. Infected cells were then grown in the presence of puromycin, and viable cells were photographed by light microscopy after 4 days of selection. Magnification, ×95. (B) Protein expression in puromycin-resistant populations of 786-O cells. Whole-cell extracts were prepared from puromycin-resistant 786-O cells infected as in panel A and immunoblotted with either anti-PTEN or anti-HA antibodies. (C and D) MTS assays were performed, as described in Materials and Methods, to quantify the results shown in panel A. To normalize the results between the two cell lines, cell viability is expressed as a percentage of the vector controls. The data shown are the mean and standard error of independent duplicates and are representative of two independent infections.
FIG. 7
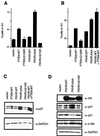
FKHR induces a G1 arrest in PTEN-null 786-O cells. (A) FKHR;AAA induces a G1 arrest in PTEN-null 786-O cells. 786-O cells were transiently transfected with pCD19 and plasmids directing the expression of the indicated proteins. At 48 h after transfection, the cell cycle distribution of the transfected cells was determined by combined fluorescein isothiocyanate-conjugated anti-CD19 and propidium iodide staining. The data shown are the mean and standard error of replicates and are representative of two independent experiments. (B) PTEN cooperates with FKHR to induce a cell cycle arrest. 786-O cells were transfected with pCD19 and plasmids directing the expression of the indicated proteins. The data shown are as in panel A. (C) PTEN and FKHR;AAA induce p27 in 786-O cells. 786-O cells were transiently transfected with a plasmid encoding the cell surface marker CD19, along with either vector plasmid, or plasmids encoding the indicated proteins. At 36 h after transfection, cells were harvested by trypsinization and collected on anti-CD19-coated magnetic beads. A 75-μg portion of whole-cell extracts, derived from the isolated cells, was separated by gel electrophoresis and immunoblotted with the indicated antibody reagents. (D) FKHR;AAA induces p27 but does not induce p21. 786-O cells were infected with retroviruses encoding the indicated proteins and selected with puromycin. Following selection, protein extracts were prepared and immunoblotted with the indicated antibody reagents.
FIG. 8
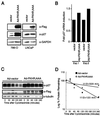
FKHR;AAA induces p27 mRNA and prolongs the half-life of p27 protein. (A) FKHR;AAA induces p27 in 786-O cells but not in LNCaP cells. 786-O and LNCaP cells were infected with either Ad-vector or Ad-FKHR;AAA as indicated. At 36 h after infection, protein extracts were prepared and immunoblotted with the indicated antibody reagents. (B) FKHR;AAA induces p27 mRNA in 786-O cells. 786-O cells were infected with Ad-vector or Ad-FKHR;AAA as indicated. At 24 h after infection, the cells were harvested, mRNA was collected and protein extracts were prepared from duplicate plates. p27 mRNA was measured by real-time quantitative PCR using an ABI Prism 7700 sequence detector as described in Materials and Methods. Each sample was assayed in triplicate for both p27 mRNA and GAPDH mRNA. Fold induction of mRNA indicates the p27/GAPDH ratio of each sample normalized to the ratio obtained with Ad-vector. The data obtained from two independent infections performed on different days are shown. (C) FKHR;AAA prolongs the half-life of the p27 protein. 786-O cells were infected with Ad-vector or Ad-FKHR;AAA as for panel B. At 24 h after infection, cycloheximide was added to a final concentration of 25 μg/ml. The cycloheximide was present for the entire course of the experiment. Protein extracts were prepared at the indicated time points and immunoblotted with the indicated antibody reagents. (D) Calculation of the half-life of the p27 protein. Multiple radiographic exposures of the products of the experiment in panel C were obtained (data not shown). Quantitation of the p27 signal intensity was obtained from exposures in which the signal was nonsaturating for the entire time course. Signal intensities were normalized to the signal intensity obtained at time zero. The percent signal remaining was plotted on a log-linear plot, and an exponential curve fit was applied. The calculated half-life is shown. These results are representative of two independent experiments.
Similar articles
- Forkhead transcription factor FKHR-L1 modulates cytokine-dependent transcriptional regulation of p27(KIP1).
Dijkers PF, Medema RH, Pals C, Banerji L, Thomas NS, Lam EW, Burgering BM, Raaijmakers JA, Lammers JW, Koenderman L, Coffer PJ. Dijkers PF, et al. Mol Cell Biol. 2000 Dec;20(24):9138-48. doi: 10.1128/MCB.20.24.9138-9148.2000. Mol Cell Biol. 2000. PMID: 11094066 Free PMC article. - PTEN/MMAC1/TEP1 suppresses the tumorigenicity and induces G1 cell cycle arrest in human glioblastoma cells.
Li DM, Sun H. Li DM, et al. Proc Natl Acad Sci U S A. 1998 Dec 22;95(26):15406-11. doi: 10.1073/pnas.95.26.15406. Proc Natl Acad Sci U S A. 1998. PMID: 9860981 Free PMC article. - AFX-like Forkhead transcription factors mediate cell-cycle regulation by Ras and PKB through p27kip1.
Medema RH, Kops GJ, Bos JL, Burgering BM. Medema RH, et al. Nature. 2000 Apr 13;404(6779):782-7. doi: 10.1038/35008115. Nature. 2000. PMID: 10783894 - Tumor suppressors and oncogenes in cellular senescence.
Bringold F, Serrano M. Bringold F, et al. Exp Gerontol. 2000 May;35(3):317-29. doi: 10.1016/s0531-5565(00)00083-8. Exp Gerontol. 2000. PMID: 10832053 Review. - [Molecular mechanisms controlling the cell cycle: fundamental aspects and implications for oncology].
Viallard JF, Lacombe F, Belloc F, Pellegrin JL, Reiffers J. Viallard JF, et al. Cancer Radiother. 2001 Apr;5(2):109-29. doi: 10.1016/s1278-3218(01)00087-7. Cancer Radiother. 2001. PMID: 11355576 Review. French.
Cited by
- O-GlcNAcylation mediates H2O2-induced apoptosis through regulation of STAT3 and FOXO1.
Zhang CC, Li Y, Jiang CY, Le QM, Liu X, Ma L, Wang FF. Zhang CC, et al. Acta Pharmacol Sin. 2024 Apr;45(4):714-727. doi: 10.1038/s41401-023-01218-z. Epub 2024 Jan 8. Acta Pharmacol Sin. 2024. PMID: 38191912 - Epigallocatechin gallate inhibits ovarian cancer cell growth and induces cell apoptosis via activation of FOXO3A.
Zhang Z, Zhang Q, Yu Y, Su S. Zhang Z, et al. In Vitro Cell Dev Biol Anim. 2023 Dec;59(10):739-746. doi: 10.1007/s11626-023-00830-x. Epub 2023 Dec 1. In Vitro Cell Dev Biol Anim. 2023. PMID: 38038884 - Synthetic lethal approaches to target cancers with loss of PTEN function.
Ertay A, Ewing RM, Wang Y. Ertay A, et al. Genes Dis. 2023 Nov;10(6):2511-2527. doi: 10.1016/j.gendis.2022.12.015. Genes Dis. 2023. PMID: 37533462 Free PMC article. - The Role of Polo-Like Kinase 1 in Regulating the Forkhead Box Family Transcription Factors.
Moore XTR, Gheghiani L, Fu Z. Moore XTR, et al. Cells. 2023 May 8;12(9):1344. doi: 10.3390/cells12091344. Cells. 2023. PMID: 37174744 Free PMC article. Review. - HMGA2 drives the IGFBP1/AKT pathway to counteract the increase in P27KIP1 protein levels in mtDNA/RNA-less cancer cells.
Maruyama T, Saito K, Higurashi M, Ishikawa F, Kohno Y, Mori K, Shibanuma M. Maruyama T, et al. Cancer Sci. 2023 Jan;114(1):152-163. doi: 10.1111/cas.15582. Epub 2022 Sep 26. Cancer Sci. 2023. PMID: 36102493 Free PMC article.
References
- Bellacosa A, de Feo D, Godwin A K, Bell D W, Cheng J Q, Altomare D A, Wan M, Dubeau L, Scambia G, Masciullo V, et al. Molecular alterations of the AKT2 oncogene in ovarian and breast carcinomas. Int J Cancer. 1995;64:280–285. - PubMed
- Bellacosa A, Testa J R, Staal S P, Tsichlis P N. A retroviral oncogene, akt, encoding a serine-threonine kinase containing an SH2-like region. Science. 1991;254:274–277. - PubMed
- Brunet A, Bonni A, Zigmond M J, Lin M Z, Juo P, Hu L S, Anderson M J, Arden K C, Blenis J, Greenberg M E. Akt promotes cell survival by phosphorylating and inhibiting a Forkhead transcription factor. Cell. 1999;96:857–868. - PubMed
Publication types
MeSH terms
Substances
LinkOut - more resources
Full Text Sources
Other Literature Sources
Research Materials
Miscellaneous
