The activation mechanism of rat vanilloid receptor 1 by capsaicin involves the pore domain and differs from the activation by either acid or heat - PubMed (original) (raw)
The activation mechanism of rat vanilloid receptor 1 by capsaicin involves the pore domain and differs from the activation by either acid or heat
J M Welch et al. Proc Natl Acad Sci U S A. 2000.
Abstract
The recently cloned rat vanilloid receptor, VR1, can be activated by capsaicin, acid, and heat. To determine the molecular mechanisms facilitating channel opening in response to these stimuli, VR1 and six channels containing charge neutralization point mutations surrounding the putative channel pore domain were expressed and characterized in Xenopus laevis oocytes. Steady-state dose-response relationships, current-voltage relationships, ionic selectivities, and single-channel properties were recorded using voltage-clamp techniques. Three of the mutant channels are significantly more sensitive to capsaicin than is wild-type VR1, whereas none differed in their activation by acidic pH or temperature. Furthermore, one of the mutants has lost all positive cooperativity for capsaicin activation (Hill coefficient congruent with 1, VR1 congruent with 2), is much more selective for Ca(2+), and exhibits a lower efficacy for acid than for capsaicin activation. Single-channel recordings show that capsaicin- and acid-activated channels have the same conductance, that the three mutants with increased capsaicin sensitivity exhibit higher open probabilities at submaximal capsaicin concentrations, and that the gating properties of capsaicin activation differ from those of acid activation. These data indicate that VR1 undergoes conformational changes upon capsaicin binding that it does not undergo in response to activation by protons or thermal stimuli. Furthermore, these structural rearrangements include the putative pore domain and reveal the location of an intracellular domain that contributes to the positive cooperativity seen for capsaicin activation.
Figures
Figure 1
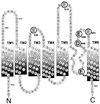
Predicted transmembrane domains of VR1 highlighting amino acids that were mutated (large type). All mutations were D→N or E→Q. Residues whose mutation results in an altered capsaicin sensitivity are highlighted in bold. The N-terminal 426 amino acids and the C terminus from residues 688 to 838 are not shown.
Figure 2
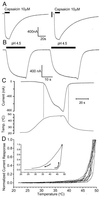
Capsaicin, protons, and heat activate VR1 receptors. (A) Inward currents induced by two consecutive applications of the maximally effective dose (10 μM) of capsaicin. Capsaicin was applied to VR1-injected oocytes for 15 s (solid bar), perfused for 5–10 min (axis break marks), and reapplied for a 15-s pulse (solid bar). (B) Inward currents induced by two consecutive applications of maximally effective (pH 4.5) buffers. Solutions set to pH 4.5 were perfused for 15 s or 25 s (solid bars). (C) Upper trace: Current response of VR1 receptors to changes in temperature. Lower trace: Perfusate temperatures. The vertical lines indicate the threshold temperatures for VR1 channel activation and channel deactivation. (D) Representative plots of normalized current responses in response to increases in perfusate temperature. Temperature ramps from ≅22°C to 48 and 49°C in 12 oocytes injected with VR1 mRNA. Inward current magnitudes are normalized to peak currents. _V_h = −25 mV.
Figure 3
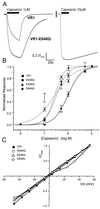
Responsiveness of VR1 and mutants to capsaicin. (A) Normalized current responses by the sequential application of 1 μM and 10 μM capsaicin to cells expressing either VR1 receptors or VR1-E648Q receptors. The interstimulus interval was always longer than 5 min. (B) Capsaicin dose-response data for VR1 and mutants. Each point represents the mean ± SEM for 2EVC data from at least four independent oocytes. The solid and dashed lines are optimized fits to the Hill equation. Open symbols indicate the relative _P_o values obtained from single-channel records of VR1 (□), E648Q (○), and E636Q (Δ). (C) Current-voltage relationship for VR1, E648Q, E636Q, and D646N. Steady-state currents were recorded at a series of voltages in the presence and absence of 10 μM capsaicin. Plots are normalized to maximal steady-state currents. Error bars (SEM) are omitted for the sake of clarity but were always less than 0.18_I/I_max.
Figure 4
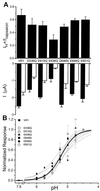
Efficacy and pH dose response of VR1 and mutants. (A) Relative efficacy of capsaicin and proton activation of VR1 and point mutants. Lower bars show the absolute steady-state current responses to 10 μM capsaicin (filled) or pH 4.5 buffer (open) measured from VR1 or mutant-expressing oocytes. Each oocyte was used for only one pulse of one type of activator (n = 5–6 per activator). Upper bars show the mean_I_H+_/I_capsaicin ratio calculated by random pairing of capsaicin and proton trials. (B) Acid dose-response curves. Currents are normalized to the maximal response elicited by the pH 4.5 buffer. Each point represents the mean ± SEM currents obtained from at least four independent experiments. The lines shown are optimized fits to the Hill equation: ■, solid thick line, VR1; dashed lines, point mutations. _V_h = −25 mV.
Figure 5
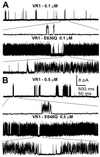
Single-channel recordings of VR1, E636Q, and E648Q activated by capsaicin. I/O patch-clamp records were obtained from oocytes expressing these receptors and exposed to the capsaicin concentrations shown. Channel gating using an expanded time scale is shown below each trace. (A) Representative traces of VR1 (upper) and E636Q (lower) activated by 0.1 μM capsaicin. (B) Representative traces of VR1 (upper) E648Q (lower) channels activated by 0.5 μM capsaicin. _V_h = +80 mV.
Figure 6
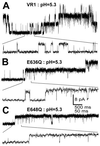
Single-channel recordings of VR1, E636Q, and E648Q activated by pH. O/O patch clamp records were obtained from oocytes expressing these receptors and exposed to pH 5.3 buffers. Channel gating using an expanded time scale is shown below each trace. (A) Representative traces of VR1 channels activated by pH 5.3. (B) Representative traces of VR1-E636Q receptors activated by pH 5.3. (C) Representative traces of VR1-E648Q receptors activated by pH 5.3._V_h = +80 mV.
Figure 7
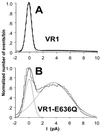
All-points amplitude histograms constructed from single-channel records of VR1 and VR1-E636Q in the presence of 0.1 μM capsaicin. (A) Current values from a single-channel VR1 trace at 0.1 μM were collected in 0.2-pA bins, and the resulting histogram was fit with a second-order Gaussian (dashed lines). The sum of these fits is shown as a smooth solid line. The area under each Gaussian fit was used to calculate _P_o for VR1 (0.03) and VR1-E636Q (0.56).
Similar articles
- Capsaicin activation of the pain receptor, VR1: multiple open states from both partial and full binding.
Hui K, Liu B, Qin F. Hui K, et al. Biophys J. 2003 May;84(5):2957-68. doi: 10.1016/S0006-3495(03)70022-8. Biophys J. 2003. PMID: 12719227 Free PMC article. - Pharmacological differences between the human and rat vanilloid receptor 1 (VR1).
McIntyre P, McLatchie LM, Chambers A, Phillips E, Clarke M, Savidge J, Toms C, Peacock M, Shah K, Winter J, Weerasakera N, Webb M, Rang HP, Bevan S, James IF. McIntyre P, et al. Br J Pharmacol. 2001 Mar;132(5):1084-94. doi: 10.1038/sj.bjp.0703918. Br J Pharmacol. 2001. PMID: 11226139 Free PMC article. - Functional analysis of capsaicin receptor (vanilloid receptor subtype 1) multimerization and agonist responsiveness using a dominant negative mutation.
Kuzhikandathil EV, Wang H, Szabo T, Morozova N, Blumberg PM, Oxford GS. Kuzhikandathil EV, et al. J Neurosci. 2001 Nov 15;21(22):8697-706. doi: 10.1523/JNEUROSCI.21-22-08697.2001. J Neurosci. 2001. PMID: 11698581 Free PMC article. - Capsaicin receptor in the pain pathway.
Tominaga M, Julius D. Tominaga M, et al. Jpn J Pharmacol. 2000 May;83(1):20-4. doi: 10.1254/jjp.83.20. Jpn J Pharmacol. 2000. PMID: 10887936 Review. - Vanilloid receptor ligands: hopes and realities for the future.
Szallasi A. Szallasi A. Drugs Aging. 2001;18(8):561-73. doi: 10.2165/00002512-200118080-00001. Drugs Aging. 2001. PMID: 11587243 Review.
Cited by
- Proton block of proton-activated TRPV1 current.
Lee BH, Zheng J. Lee BH, et al. J Gen Physiol. 2015 Aug;146(2):147-59. doi: 10.1085/jgp.201511386. Epub 2015 Jul 13. J Gen Physiol. 2015. PMID: 26170176 Free PMC article. - Effects of piperine, the pungent component of black pepper, at the human vanilloid receptor (TRPV1).
McNamara FN, Randall A, Gunthorpe MJ. McNamara FN, et al. Br J Pharmacol. 2005 Mar;144(6):781-90. doi: 10.1038/sj.bjp.0706040. Br J Pharmacol. 2005. PMID: 15685214 Free PMC article. - Tunable calcium current through TRPV1 receptor channels.
Samways DS, Khakh BS, Egan TM. Samways DS, et al. J Biol Chem. 2008 Nov 14;283(46):31274-8. doi: 10.1074/jbc.C800131200. Epub 2008 Sep 5. J Biol Chem. 2008. PMID: 18775990 Free PMC article. - A molecular perspective on identifying TRPV1 thermosensitive regions and disentangling polymodal activation.
Luu DD, Owens AM, Mebrat MD, Van Horn WD. Luu DD, et al. Temperature (Austin). 2021 Oct 26;10(1):67-101. doi: 10.1080/23328940.2021.1983354. eCollection 2023. Temperature (Austin). 2021. PMID: 37187836 Free PMC article. Review. - Membrane Protein Properties Revealed through Data-Rich Electrostatics Calculations.
Marcoline FV, Bethel N, Guerriero CJ, Brodsky JL, Grabe M. Marcoline FV, et al. Structure. 2015 Aug 4;23(8):1526-1537. doi: 10.1016/j.str.2015.05.014. Epub 2015 Jun 25. Structure. 2015. PMID: 26118532 Free PMC article.
References
- Szallasi A, Blumberg P M. Pharmacol Rev. 1999;51:159–211. - PubMed
- Kress M, Zeilhofer M U. Trends Pharmacol Sci. 1999;20:112–118. - PubMed
- Caterina M J, Leffler A, Malmberg A B, Martin W J, Trafton J, Petersen-Zeitz K R, Koltzenberg M, Basbaum A I, Julius D. Science. 2000;288:306–313. - PubMed
- Caterina M J, Schumacher M A, Tominaga M, Rosen T A, Levine J D, Julius D. Nature (London) 1997;389:816–824. - PubMed
- Zygmunt P M, Petersson J, Anderson D A, Chuang H, Sorgard M, Di Marzo V, Julius D, Hogestatt E D. Nature (London) 1999;400:452–457. - PubMed
Publication types
MeSH terms
Substances
LinkOut - more resources
Full Text Sources
Other Literature Sources
Miscellaneous
