Ablation of the retinoblastoma gene family deregulates G(1) control causing immortalization and increased cell turnover under growth-restricting conditions - PubMed (original) (raw)
Ablation of the retinoblastoma gene family deregulates G(1) control causing immortalization and increased cell turnover under growth-restricting conditions
J H Dannenberg et al. Genes Dev. 2000.
Abstract
The retinoblastoma suppressor pRB belongs to the family of so-called pocket proteins, which also includes p107 and p130. These proteins may functionally overlap in cell cycle control and tumor suppression. We have generated an isogenic set of embryonic stem (ES) cell lines carrying single or compound loss-of-function mutations in the Rb gene family, including a cell line completely devoid of all three pocket proteins. None of the knockout combinations affected the growth characteristics of ES cells; however, concomitant ablation of all three pocket proteins strongly impaired their differentiation capacity. For the generated genotypes, primary mouse embryonic fibroblasts (MEFs) also were obtained. While inactivation of Rb alone did not alleviate the senescence response of MEFs, pRB/p107-deficient MEFs, after having adapted to in vitro culturing, continued to proliferate at modest rate. Additional ablation of p130 rendered MEFs completely insensitive to senescence-inducing signals and strongly increased their proliferation rate. Although triple-knockout MEFs retained anchorage dependence, they lacked proper G(1) control and showed increased cell turnover under growth-inhibiting conditions.
Figures
Figure 1
Generation of Rb−/−p107−/−p130 −/− ES cells and MEFs. (A) Restriction map of the wild-type p130 allele around codon 405 at the _Ava_I site and 129_p130_-pur DNA targeting construct. Probes 1 and 2 detect modifications at p130. (B) Western blot analysis of p130 in lysates prepared from p130 +/+ and p130 −/− brain tissue. (C) PCR analysis of Rb, p107 and p130 of DNA isolated from passage 1 wt, Rb −/−, Rb−/−p107 −/− and TKO MEFs. PCR products resulting from wild-type and knockout alleles of each gene are indicated by open and solid arrows, respectively. (D) Western blot analysis of pRB, p107, p130, and Cyclin E in lysates prepared from indicated MEFs. Cdk4 served as a loading control.
Figure 2
Limited differentiation in TKO teratocarcinomas. Histological sections of teratocarcinomas were stained with hematoxylin-eosin. (A,B) Advanced neuronal (N) and muscle (M) differentiation in teratocarcinomas generated with wt ES cells. Similar results were obtained with Rb −/− and Rb−/−p107 −/− ES cells. (C,D) Cell-dense TKO teratocarcinomas lack muscle differentiation and exist of primitive, relatively undifferentiated neuronal cells (PN) with rosette-like structures (R). Magnification (A,C) objective 10×, (B,D) objective 20×.
Figure 3
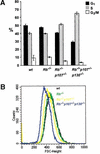
Deregulated G1-control in TKO MEFs. (A) Percentages of G1, S, and G2/M phases of the cell cycle in proliferating wild-type (wt) and pocket-protein-deficient MEFs. Results are indicated as average values of three independent experiments. Error bars indicate standard deviations of the mean. (B) FSC-H histogram showing cell-size analysis of MEFs deficient for Rb, p107, and p130 compared with wt counterparts. The forward scatter, FSC-H, is indicative for the cell diameter, and a shift to the left, relative to the wt MEFs, represents smaller cells.
Figure 4
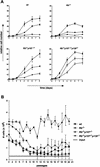
Growth characteristics of pocket-protein-deficient MEFs. (A) Growth curves of wt, Rb −/−, Rb−/−p107 −/−, and TKO MEFs at passages 3 (squares), 5 (circles), and 7 (triangles). The figure shows a representative of three independent experiments, each performed in triplicate. (B) Cell proliferation on a 3T9-based protocol of indicated MEFs for 20 passages. At 3.5-d intervals, the total numbers of cells of three independent cultures of each genotype were determined before redilution of the cells to 3 × 10⁵ per six-well plate (input). The experiment was performed twice. Error bars indicate standard deviations of the mean.
Figure 5
Intact p19ARF/p53 pathway in immortal TKO MEFs. (A) Indicated MEFs were passaged according to a 3T9 protocol, and cell pellets were collected at passages 3, 5, and 7. Cell lysates were analyzed for p16INK4A, p19ARF and tubulin levels by immunoblotting. Ink4a −/− MEFs served as a negative control. (B) Expression of p53 and p21CIP in wt and TKO MEFs at passages 3 and 6. (C) Expression analysis of p21CIP in control and γ-irradiated early passage wt, Rb−/−p107 −/− and TKO MEFs showing induction of p21Cip in all genotypes 24 h after irradiation. (D) Expression analysis of p19ARF in six independent TKO 3T9 clones (1–6). All clones expressed p19Arf, whereas a wild-type 3T9 clone (3T9_wt_, 1) had lost expression of this protein. p19Arf −/− MEFs served as a negative control. (E) Induction of p21Cip in γ-irradiated wt (1) and TKO (1–6) 3T9 MEF cell lines compared to γ-irradiated early passage wt and TKO MEFs.
Figure 6
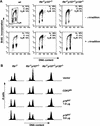
Defective G1 checkpoint in TKO MEFs on irradiation and ectopic p19Arf expression. (A) γ-irradiation induced a G2/M arrest in Rb−/−p107 −/− and TKO MEFs. Percentages of G1, S, and G2/M phases of the cell cycle in nonirradiated and irradiated (5.5 Gy) MEFs were measured by FITC-PI FACS analysis and plotted as FL3-A (_X_-axis)–FL1-H (_Y_-axis) dot plots. (B) Ectopic expression of p19Arf induces a pocket-protein-dependent G1 arrest. FACS analysis of GFP-positive Rb −/−, Rb−/−p107 −/− and TKO MEFs expressing either vector plasmid, a dominant-negative variant of CDK2, or p19Arf (1.0 or 5.0 μg) together with a histone H2B-GFP expression construct in a 10 : 1 ratio. Representative results of three independent experiments are shown.
Figure 7
Increased cell turnover in TKO MEFs under growth-inhibiting conditions. (A) Distribution of G1, S, and G2/M phases of indicated MEFs at 0.1% FCS. (B) Growth curves of indicated MEFs at 0.1% FCS. (C) Percentage of apoptotic cells in indicated MEF cultures at 0.1% FCS, 24 h (black), and 96 h (grey) after growth-factor depletion. Percentages were obtained by determing the sub-G1 population in a FL3A-log histogram. (D) Distribution of G1, S, and G2/M phases of indicated contact-inhibited MEFs. (E) Percentage apoptotic cells in contact-inhibited MEF cultures. Average values of three independent experiments are indicated in percentages. Error bars indicate standard deviations from the mean (A,C,D,E).
References
- Bates S, Phillips AC, Clark PA, Stott F, Peters G, Ludwig RL, Vousden KH. p14ARF links the tumour suppressors RB and p53. Nature. 1998;395:124–125. - PubMed
- Bernards R. E2F: A nodal point in cell cycle regulation. Bichim Biophys Acta. 1997;1333:33–40. - PubMed
- Berns K, Martins C, Dannenberg J-H, Berns A, te Riele H, Bernards R. p27kip-independent cell cycle regulation by MYC. Oncogene. 2000;19:4822–4827. - PubMed
- Brugarolas J, Chandrasekaran C, Gordon JI, Beach D, Jacks T, Hannon GJ. Radiation-induced cell cycle arrest compromised by p21 deficiency. Nature. 1995;377:552–557. - PubMed
Publication types
MeSH terms
Substances
LinkOut - more resources
Full Text Sources
Other Literature Sources
Molecular Biology Databases


